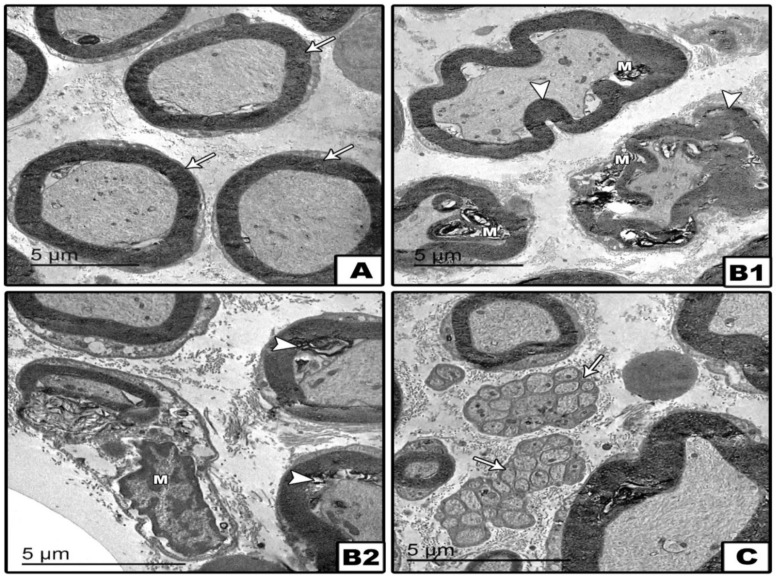
Figure 9.
Transmission electron microscopy images of sections of the spinal cord. Images in groups; control, diabetic, and treated diabetic group. Panel (A): control section showing the normal characteristics of myelinated axons with regular myelin sheathes (arrows). Panel (B1,B2) diabetic sections showing degenerated myelinated axons (head arrows) and phagocytic microglia/macrophage cells (M) with degenerating myelin and phagocytosed matter in the cytoplasm in the white matter. The degenerated axons showing disorganized myelin sheathes with swollen vacuolated axoplasm. Microglia are surrounding the degenerated axon of a collapsed myelin sheath. Panel (C) Treated group showing myelinated axons with regular myelin sheathes, and very small unmyelinated axons were found with thickened Schwan cell basement membranes (arrows).

