Figure 3.
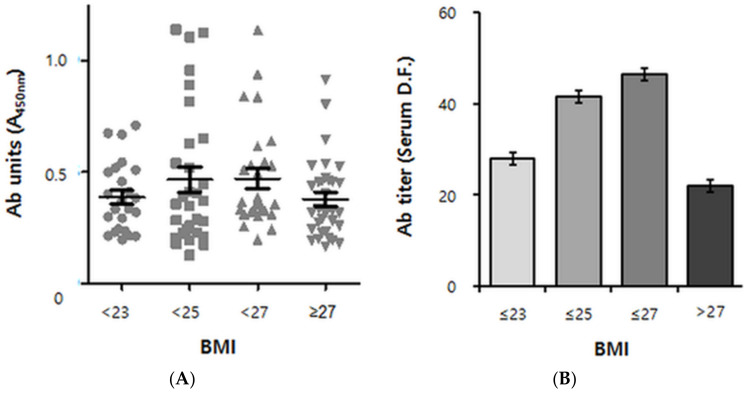
Cross-sectional analysis of human anti-pB1 antibody titer data versus BMI. (A) Scatterplot derived from 107 positive samples (out of 148 human volunteers of South Korean nationality) according to the BMI group. BMI < 23: lean, 23 ≤ BMI < 25: overweight, 25 ≤ BMI < 27: obese, 27 ≤ BMI: severely obese. n = 23, 26, 27 and 31, respectively. Ab (antibody) units indicate the absorbance of ×100 diluted sera at 450 nm. Error bars indicate means ± s.e.m. (B) Quadratic Trend Analysis of data shown in A. Antibody titers refer to serum dilution folds (D.F.) yielding an absorbance read-out of 0.5 (See “Supplementary Materials” for a detailed explanation). The association between autoantibody titers and the BMI group was adjusted for age and sex. The P value for quadratic trend was 0.0494 (p < 0.05). Error bars indicate geometric means ± s.e.m.

