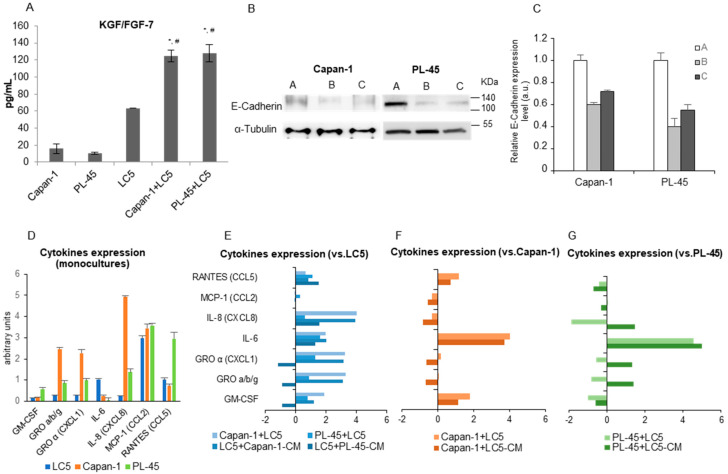
Figure 3.
Changes in protein expression and cytokine secretion in coculture models. KGF/FGF-7 concentration from supernatants of monoculture and fibroblasts-pancreatic tumor cells cocultures. FGF-7 concentration in cocultures was significantly higher than that in monocultures (*—LC5, #—corresponding tumor cell line; p < 0.0001). Data represent mean ± SD of three independent assays (A). Expression of epithelial mesenchymal transition (EMT) marker E-cadherin in pancreatic tumor cells by immunoblotting is shown. Loading control—α-Tubulin (B). Representative quantification of E-cadherin expression from Western blot is shown. A: cells grown alone at monoculture. B: cells grown at cocultures with fibroblasts (protein extracts obtained after sorting), and C: cells grown with CM from fibroblast (C). Quantification of secretome dot blots from LC5, Capan-1 and PL-45 cells growing as monocultures according to AAH-CYT-1 human cytokine antibody array is shown—represents the molecules most significantly expressed (D). Relative differences are shown by cytokine expression levels compared to LC5 monoculture (E), compared to Capan-1 monoculture (F), and compared to PL-45 monoculture (G). X-axis values shown are log2 of the normalized levels.

