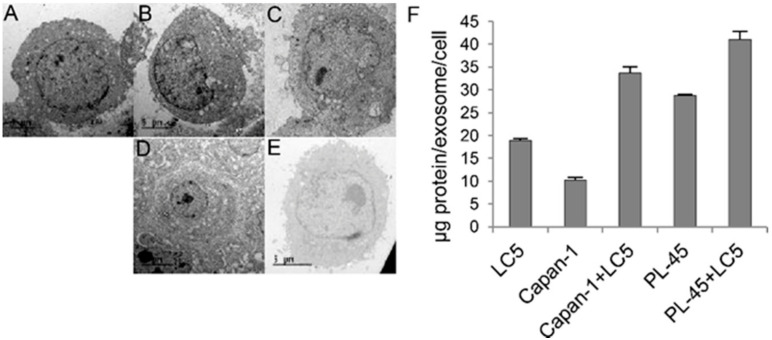
Figure 5.
Representative images by transmission electron microscopy (TEM) of cells growing for 72 h. LC5 cells growing at monoculture (A). Capan-1 cells in monoculture (B). PL-45 cells in monoculture (C). Capan-1 and LC5 cells in coculture (D). PL-45 and LC5 cells in coculture (E). Quantification of protein by exosome in monoculture and coculture conditions (F). Scale bar indicates 5 µm.

