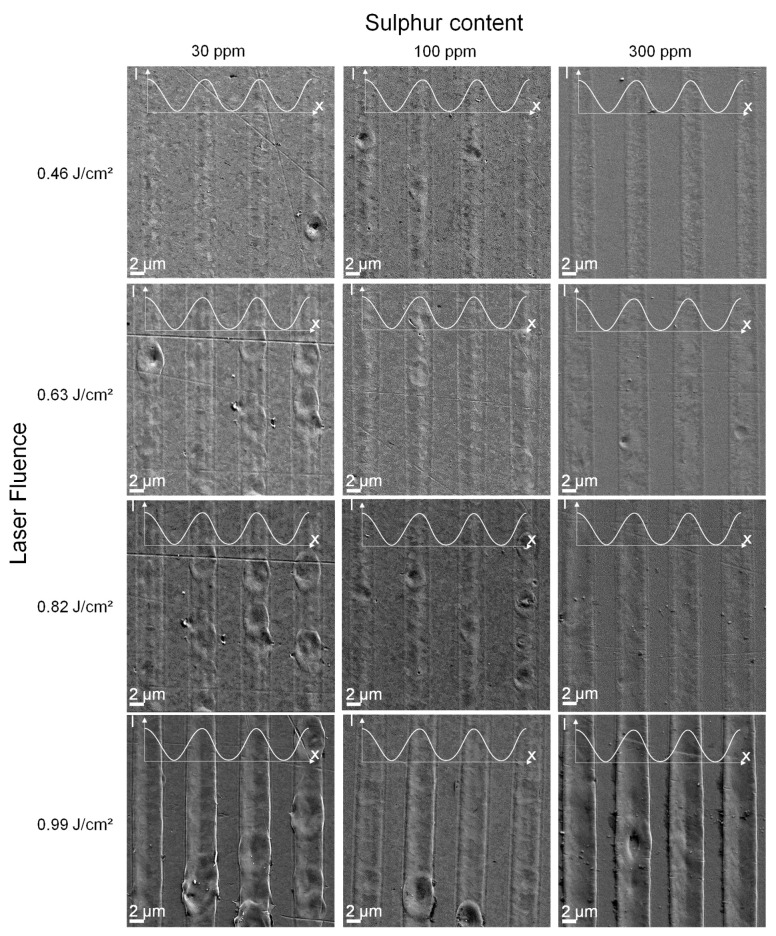
Figure 6.
Scanning electron micrographs of surfaces after DLIP ( = 1053 nm, = 7.2 µm, and = 12 ns) on steel substrates with distinct sulphur contents using a single pulse and different laser fluences. Small graphs indicate areas of maximum laser intensity. The brightness and contrast of the SEM images were enhanced for better visualisation.

