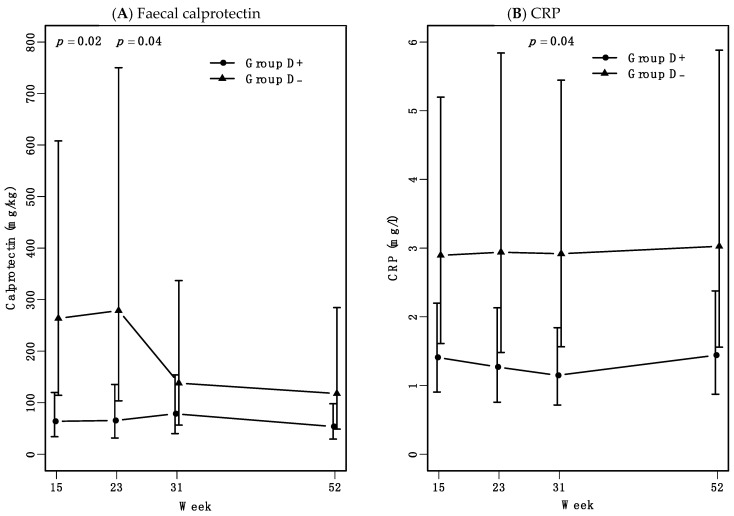
Figure 2.
Faecal calprotectin and CRP levels from weeks 15 to 52. During follow-up all patients were treated with infliximab. Data are presented as estimated medians with 95% confidence interval (CI). (A) Faecal calprotectin levels in Group D- were 3.8 times higher at both week 15 and week 23 compared to group D+. At weeks 31 and 52, calprotectin levels were not significantly different between the two groups. The overall median curves of the two groups tended to be non-parallel (mixed model, p = 0.1). (B) Median curves for CRP levels over time were close to parallel, but shifted. Group D- had a 2.2 times higher median curve compared with group D+ (p = 0.04).

