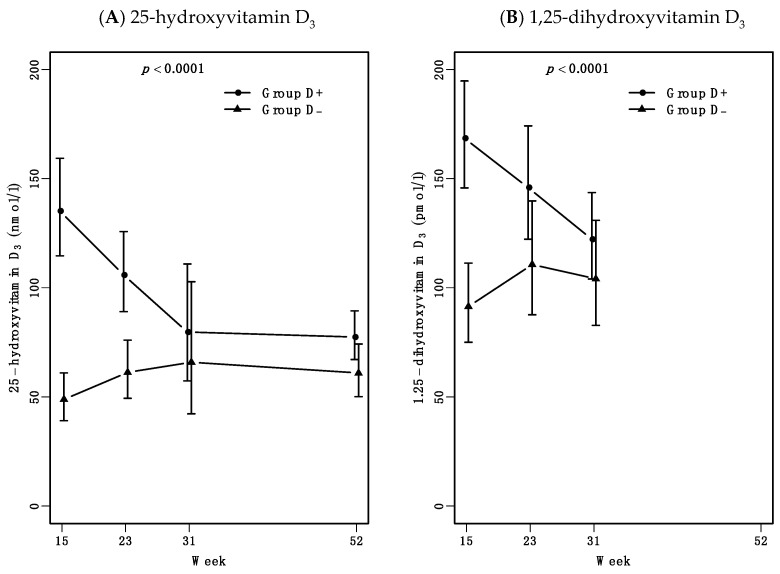
Figure 3.
25-hydroxyvitamin D and 1.25-dihydroxyvitamin D levels during follow-up. Results are presented as estimated medians with 95% confidence interval (CI), p value represent mixed model test for parallel curves. (A). 25-hydroxyvitamin D3 levels were dependent of vitamin D treatment as expected. At week 31 group D+ had decreased to comparable levels with group D-. (B). Active 1.25-dihydroxyvitamin D3 levels week 15 to 31 were also depended of vitamin D treatment.

