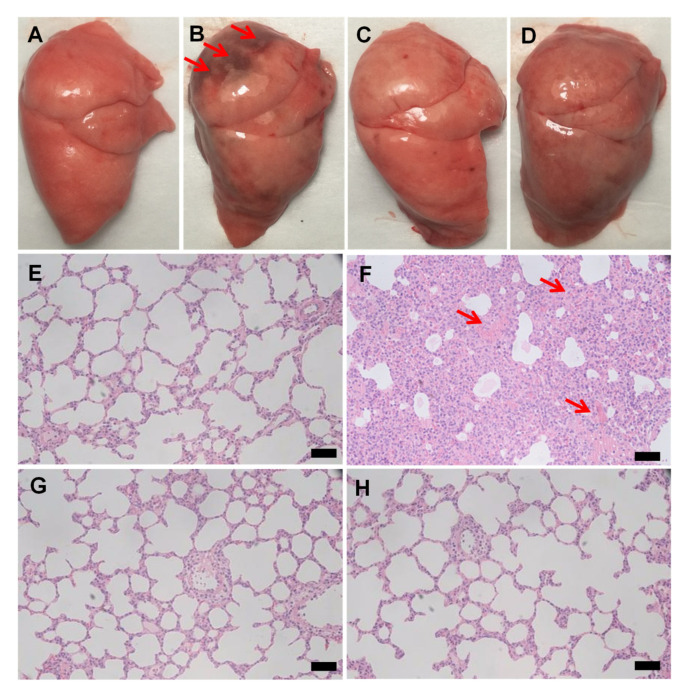
Figure 2.
The appearance of the lung tissues from the healthy rats (A), the lipopolysaccharide (LPS)-induced model group (B), the dexamethasone (DXM) group (C), and the JNDs group (D). Hematoxylin and eosin (H&E) images of the lung tissues from the healthy rats (E), the LPS-induced model group (F), the DXM group (G), and the JNDs group (H). The scale bars indicate 100 µm. The red arrows indicate lung injuries and significant hemorrhage sites.

