Figure 1.
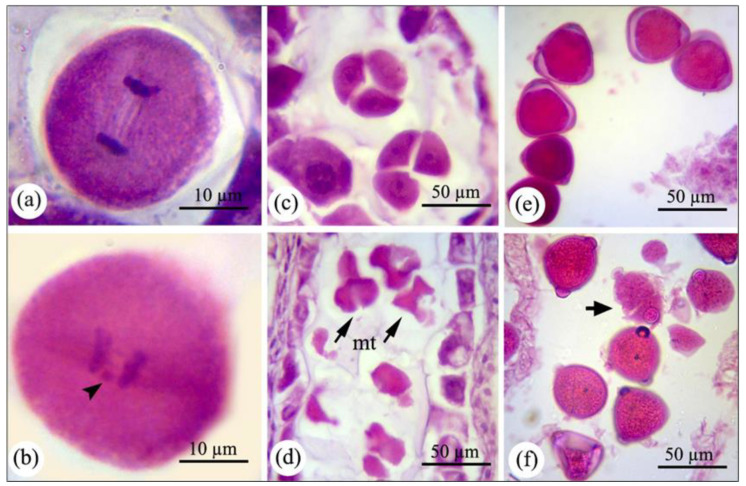
The microsporogenesis process occurred in control and 2000 mg L−1 nCeO2-treated plants. (a) Pollen mother cell at anaphase I in control plants (b) pollen mother cell at anaphase I, which chromosomes separation has not been appropriately accomplished and led to generating the laggard chromosome (arrowhead). (c) Pollen mother cell at the tetrad stage in control plants. (d) Abnormal and degenerated tetrads (arrows) in nCeO2-treated plants. (e) Mature pollen grains in control and treated plants. (f) Degenerated (arrow), and misshaped pollens are visible in anthers of plants exposed to higher dosages of nCeO2. mt, microspore tetrad.

