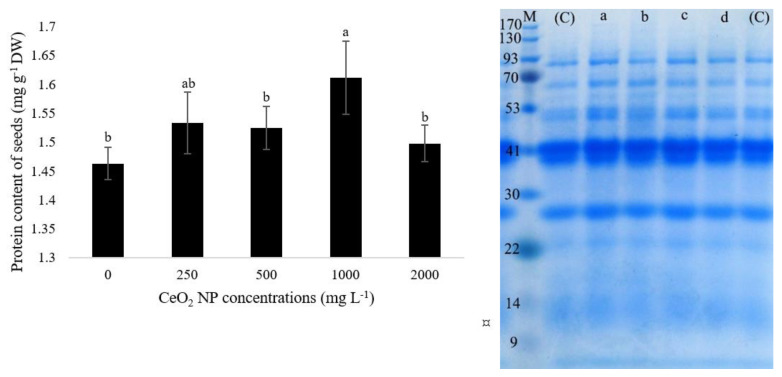
Figure 6.
Total soluble protein content in bean seeds of plants exposed to different concentrations of nCeO2 compared to control (left). SDS-PAGE profile of protein extracted from bean seeds in control and treated plants (right). (C, a, b, c, and d are related to control, 250, 500, 1000, and 2000 mg L−1 concentrations, respectively). M: molecular mass marker (CinnaGen Company). Data are means ± SE. Means followed by the same letter are not significantly different (Duncan’s test p ≤ 0.05).

