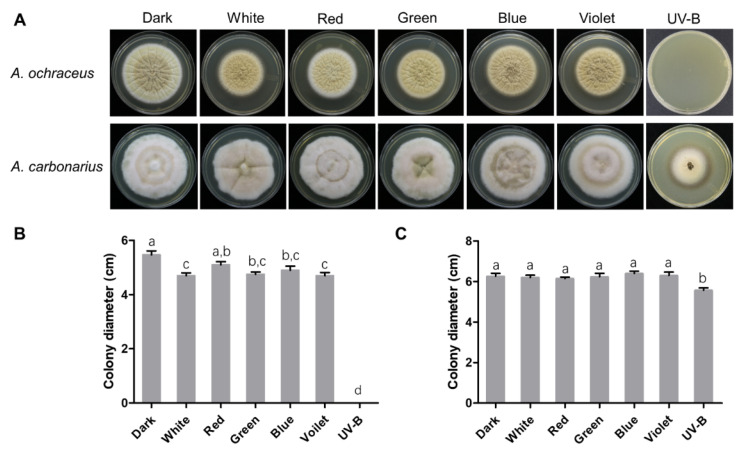
Figure 1.
The morphology of A. ochraceus and A. carbonarius under dark and light conditions. (A) A colony view of A. ochraceus and A. carbonarius under different light wavelengths. (B) The colony diameter of the A. ochraceus under different light wavelengths. (C) The colony diameter of the A. carbonarius under different light wavelengths. Each treatment indicates the average of three independent experiments and the bars indicate standard error. Different letters indicate significant differences (p < 0.05) between different treatment groups.

