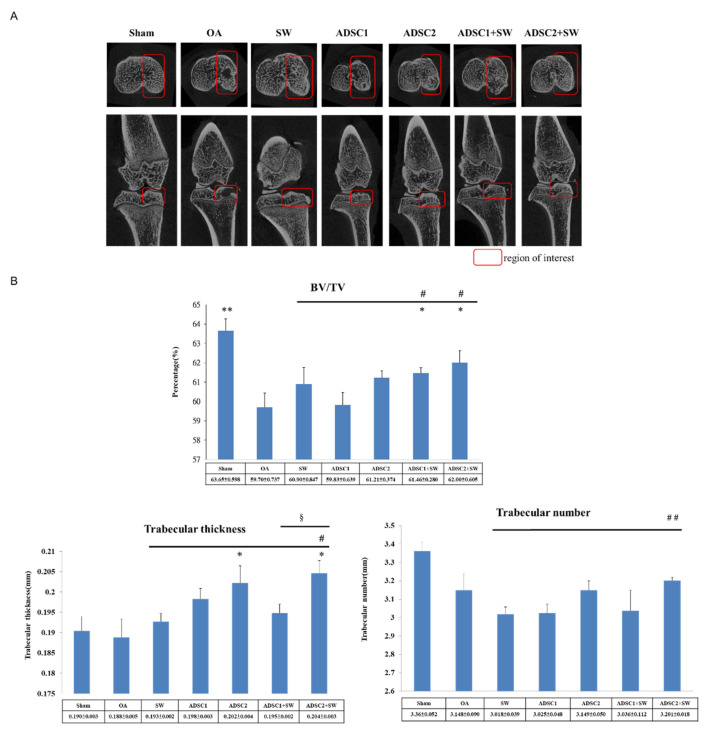
Figure 2.
The analysis of Micro-CT scans of the left rat knee after treatment. (A) Photomicrographs of the knee from the transverse (upwards) view and sagittal (downwards) view of medial tibia. The region of interest (ROI) for each group is marked (red box). (B) The data illustrate the changes in the trabecular bone volume fraction (BV/TV), trabecular thickness, and trabecular number in the ROI. * p < 0.05 and ** p < 0.01 as compared with the OA group. # p < 0.05 and ## p < 0.01 as compared with the SW group. § p < 0.05 as compared with the ADSC1 + SW and ADSC2 + SW groups. n = 6 rats in each group.

