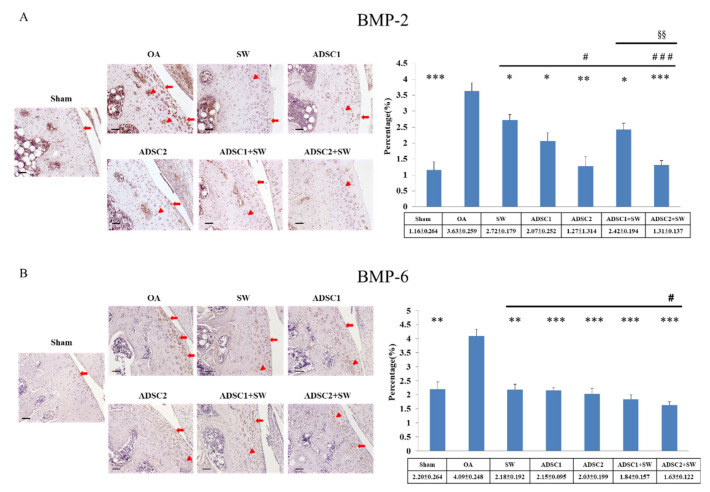
Figure 5.
The levels of inflammation-induced BMP-2 and BMP-6 in the articular cartilage of OA rat knee after treatment. (A) BMP-2 and (B) BMP-6 as measured by immunohistochemical staining in the articular cartilage of the tibia after treatment. The expression percentages were shown on the left of the images. * p < 0.05, ** p < 0.01, and *** p < 0.001 as compared with the OA group. # p < 0.05 and ### p < 0.001 as compared with the SW group. §§ p < 0.01 as compared with the ADSC1 + SW and ADSC2 + SW groups. The images were shown at 200× magnification. The scale bar was 50 μm. The triangle was indicated deep region, and the arrowhead was indicated cartilage surface. n = 6 rats in each group.

