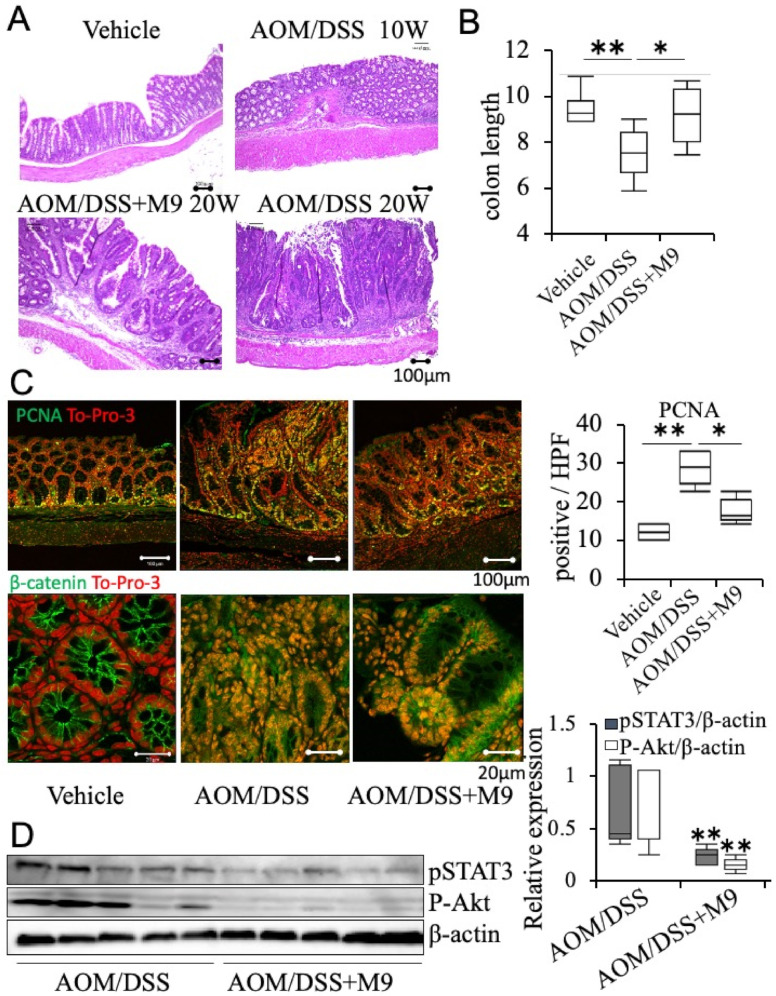
Figure 2.
Treatment with Probio-M9 ameliorated AOM/DSS-induced tumorigenesis. (A) Representative images of colon morphology, total number of tumor, and estimated tumor size per mouse. (B) Statistics of colon length. n = 10. (C) Representative image of immunohistochemistry staining for proliferating cell nuclear antigen (PCNA) in tumor areas. Positive cell number in the mucosa per high power field (HPF: 0.196 mm2) was counted and summarized in graphs. n = 5. Representative image of immunohistochemistry staining for β-catenin in vehicle intestine and tumor areas of AOM/DSS, and AOM/DSS+M9. To-Pro-3 was used to label the nucleus. (D) Representative image of immunoblotting experiments for p-STAT3 and p-Akt. β-Actin was used as an internal control. Results are summarized in graphs. n = 5. * p < 0.05; ** p < 0.01. scale bar: 100 μm.

