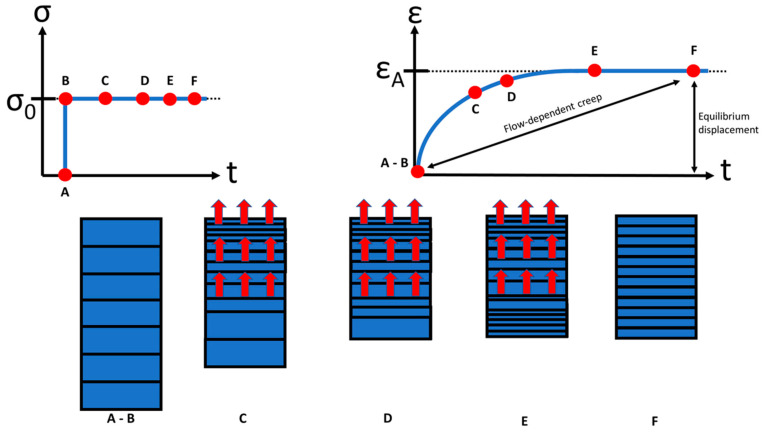
Figure 3.
A constant stress σ0 applied to a sample of AC (top left); creep response ε of the sample under the constant applied stress σ (top right). The boxes below the loading and creep curves (A to F) illustrate that creep is accompanied by fluid exudation from the tissue. At equilibrium (t → ∞), fluid flow ceases, and the load is borne entirely by the solid matrix (F). (taken and modified from [35]).

