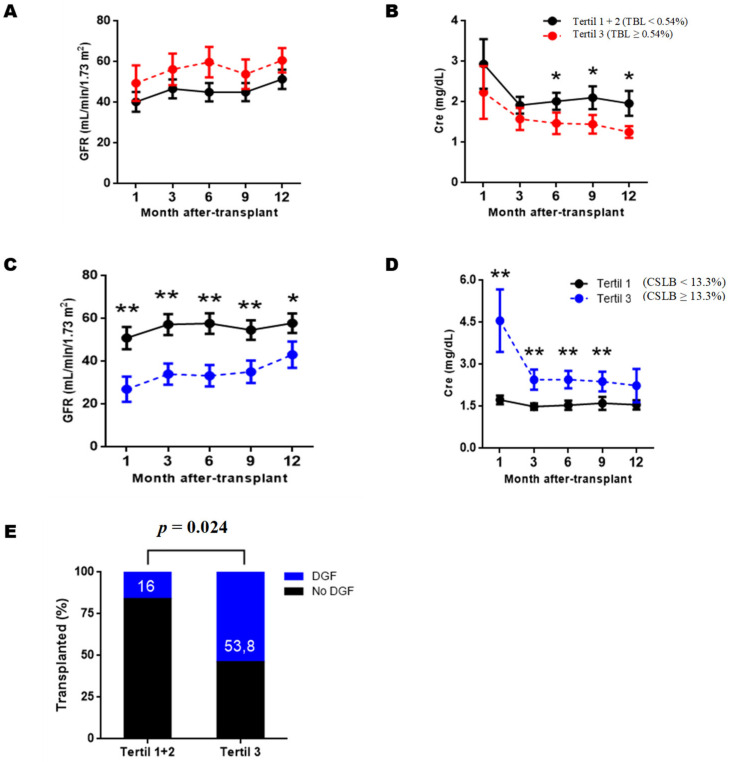
Figure 2.
Estimated glomerular filtration and serum creatinine levels of RTRs according to the transitional and Class-Switched B lymphocyte levels at 12 months post-transplantation. Renal recipients were grouped into tertiles based on transitional B lymphocytes’ relative frequencies (TBL) and Class-Switched (BLCS). At each post-transplant time, the estimated glomerular filtration rate (GFR) (A,C) and serum creatinine (Cre) (B,D) of the two groups were compared using the U-Mann–Whitney test. Fisher’s exact test (E) was used to compare delayed graft function incidence (DGF). Values are represented as the mean ± SEM. Values of p < 0.05 were considered statistically significant. * p < 0.05. ** p < 0.01.

