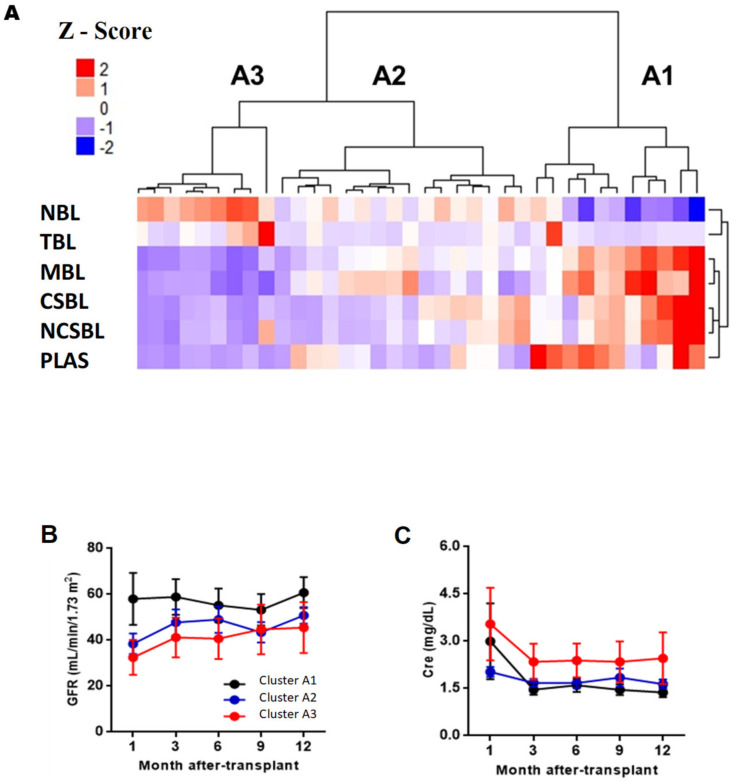
Figure 3.
Analysis of BL clusters at pre-transplantation and evolution of the estimated glomerular filtration rate and Cre. (A) Heatmap, where they represent a matrix in which the rows are the BL subpopulations and the columns the RTRs. The color grading represents the normalized values (Z-Score) obtained for each subpopulation. Evolution of the estimated glomerular filtration levels (GFR) (B) and serum creatinine (Cre) (C) during the first year after transplantation of each cluster. The FG and Cre values at each time were compared between the clusters using the Kruskal–Wallis test and Dunn’s posthoc test with Bonferroni correction for multiple comparisons. p < 0.05 were statistically significant. Abbreviations: NBL, Naive B Lymphocytes; TBL, Transitional B Lymphocytes; MBL, Memory B Lymphocytes, CSBL, Class-Switched B Lymphocytes; PLAS, Plasmablasts; NCSBL, No Class-Switched B Lymphocytes, ZBL, Zone B Lymphocytes.

