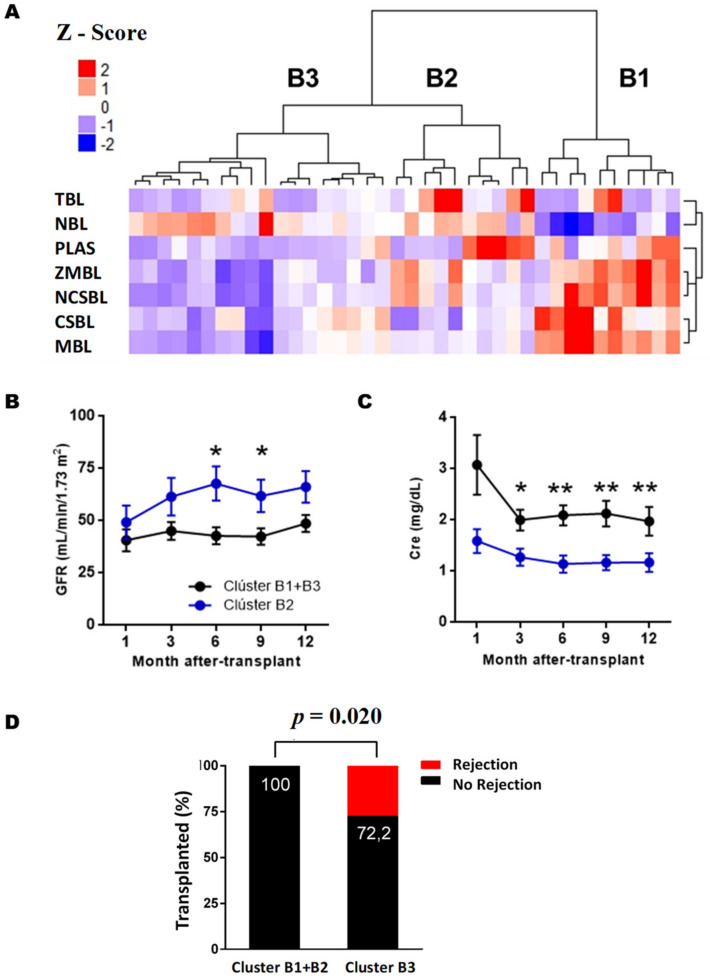
Figure 4.
Analysis of the BL clusters at three months post-transplantation. (A) Heatmap represents a matrix in which the rows are the BL subpopulations and the columns the RTRs. The color grading represents the normalized values (Z-Score) obtained for each subpopulation. Evolution of the estimated glomerular filtration levels (FG) (B) and serum creatinine (Cre) (C) during the first year after transplantation of each cluster. In figure (D), the numbers on the bars’ black background indicate the percentage of RTRs free of rejection of each group. Data are represented as the mean ± SEM. Statistical analyses were performed using the Kruskal–Wallis test and Dunn’s posthoc test with Bonferroni correction for multiple comparisons. Values p < 0.05 were considered statistically significant. Abbreviations: NBL, Naive B Lymphocytes; TBL, Transitional B Lymphocytes; MBL, Memory B Lymphocytes, CSBL, Class-Switched B Lymphocytes; PLAS, Plasmablasts; NCSBL, No Class-Switched B Lymphocytes, ZBL, Zone B Lymphocytes. * p < 0.05. ** p < 0.01.

