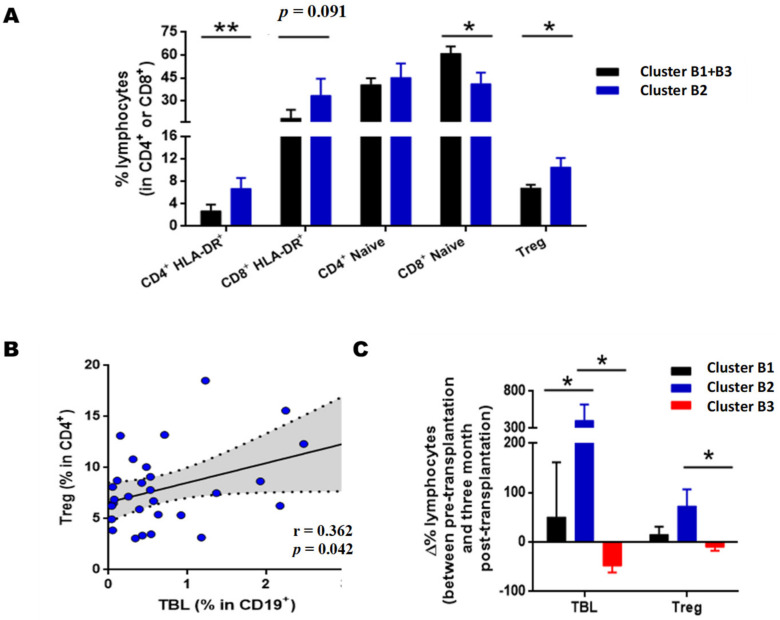
Figure 6.
T cell phenotype of clusters B1, B2, and B3. (A) Relative frequencies of activated HLA-DR+, naive and regulatory T lymphocytes (Tregs) at three months post-transplantation of clusters B1 + B3 and B2. Comparisons made using the Mann–Whitney U test. (B) Correlation between levels of Treg and transitional B lymphocytes (TBL). Analysis performed using the Spearman index. The r corresponds to the correlation coefficient, and the shaded area indicates the 95% confidence interval. (C) Percentage variation of the levels of TBL and Treg between pre-transplantation and three months after-transplant. Comparisons made using the Kruskal–Wallis test and Dunn’s post hoc test with Bonferroni correction for multiple comparisons. Values expressed as the mean ± SEM. p values < 0.05 were considered statistically significant for all analyses. * p < 0.05; ** p < 0.01.

