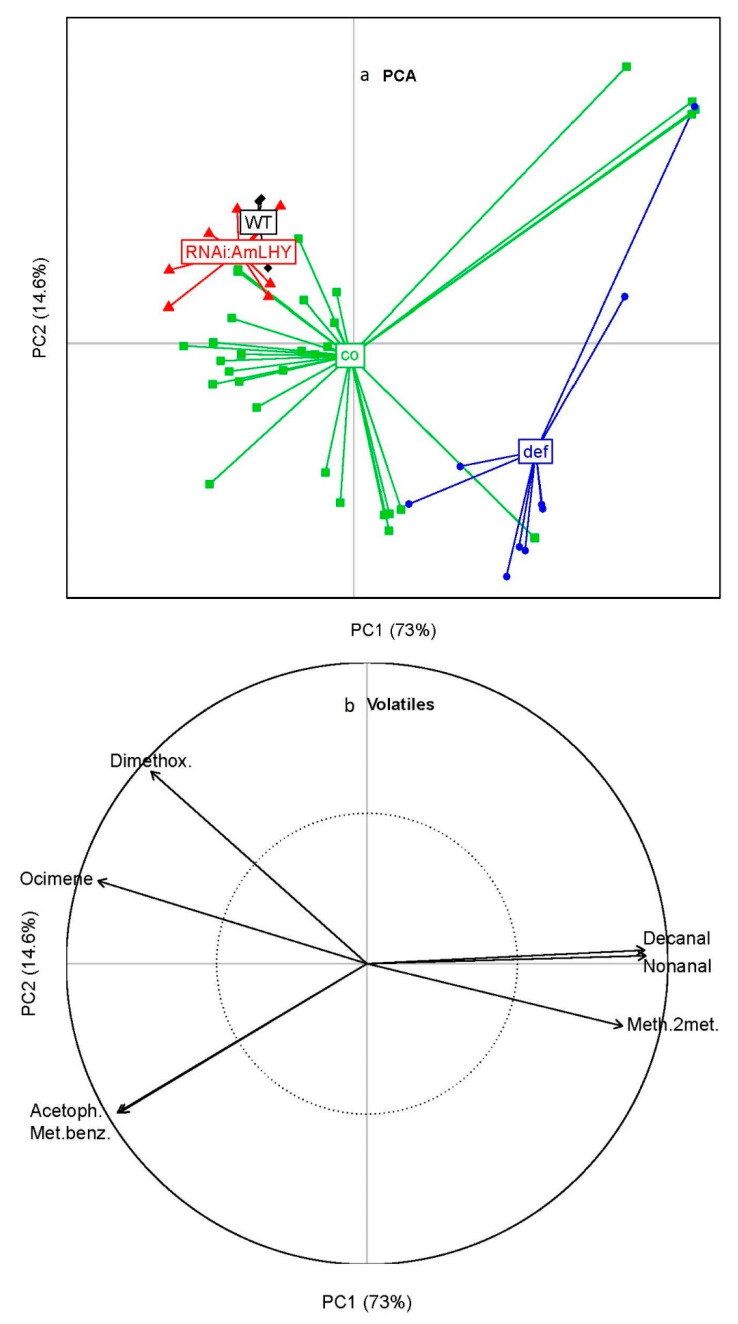
Figure 9.
Principal component analysis of snapdragon groups based on their emitted compounds. The axis PC1 and PC2 explains the 73% and 14.6% of the total variance respectively (a). Correlation circle plot that represents the contribution of volatiles (b). PC. Principal Component, co: compacta, def: deficiens, WT: wild-type, Dimethox.: 3,5-dimethoxytoluene, Acetoph.: acetophenone, Met.Benz.: methyl benzoate, Meth.2met.: methyl 2-methylbutyrate.

