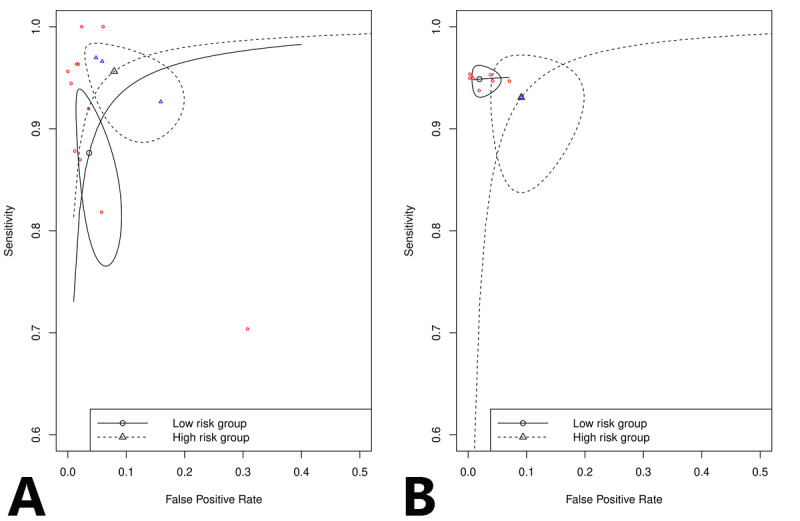
Figure 7.

Subgroup analysis of the study population, including a comparison of summary receiver operating curves between the low-risk study population, which included patients with and without atrial fibrillation, and high-risk study population, which included only patients with atrial fibrillation, for (A) non-12-lead electrocardiogram and (B) photoplethysmography.
