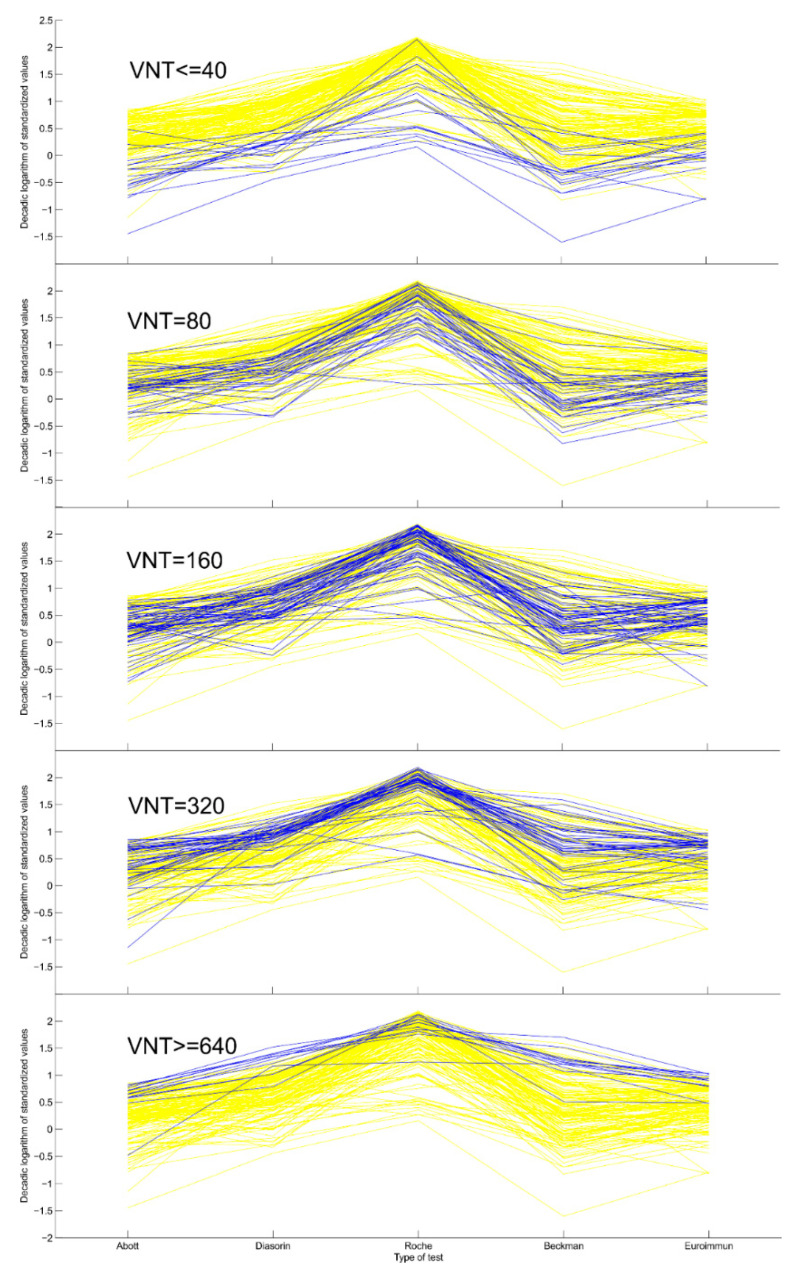
Figure 1.
Visualization of the comparison of measured concentrations of SARS-CoV-2 antibodies by individual assays and overview of the data. Legends: The results of each test were standardized by taking the (decadic) logarithm of the ratio of the test result to the cut-off for negativity (see Table 4 and the text for more details). Each yellow line represents a single sample. In each panel, samples of particular VNT value are highlighted blue. We may observe the overall agreement of the five tests (Table 3) and the general correspondence of the VNT results with the five tests.

