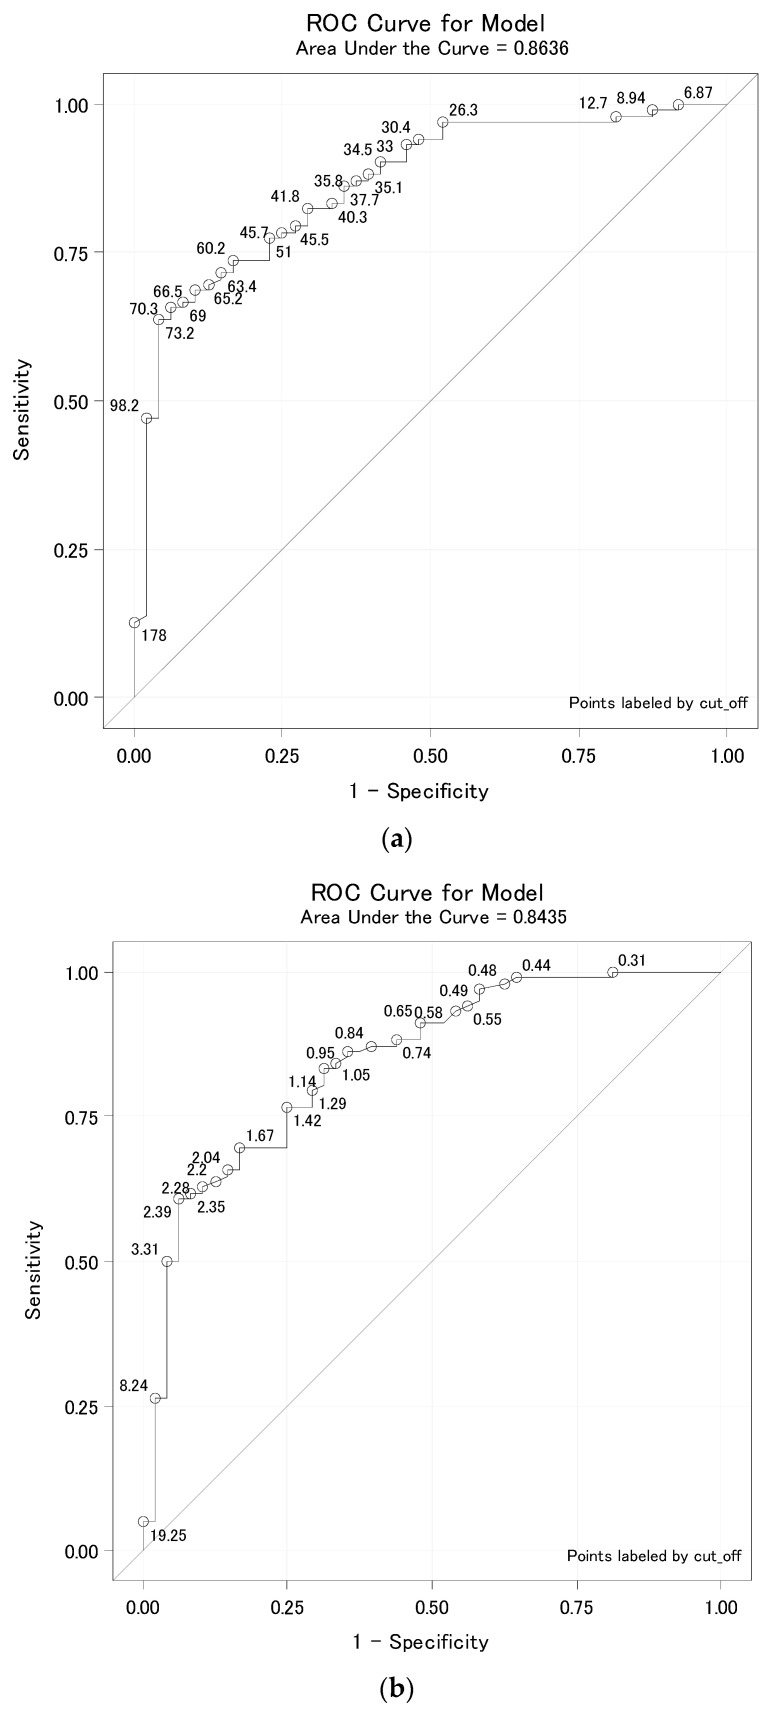
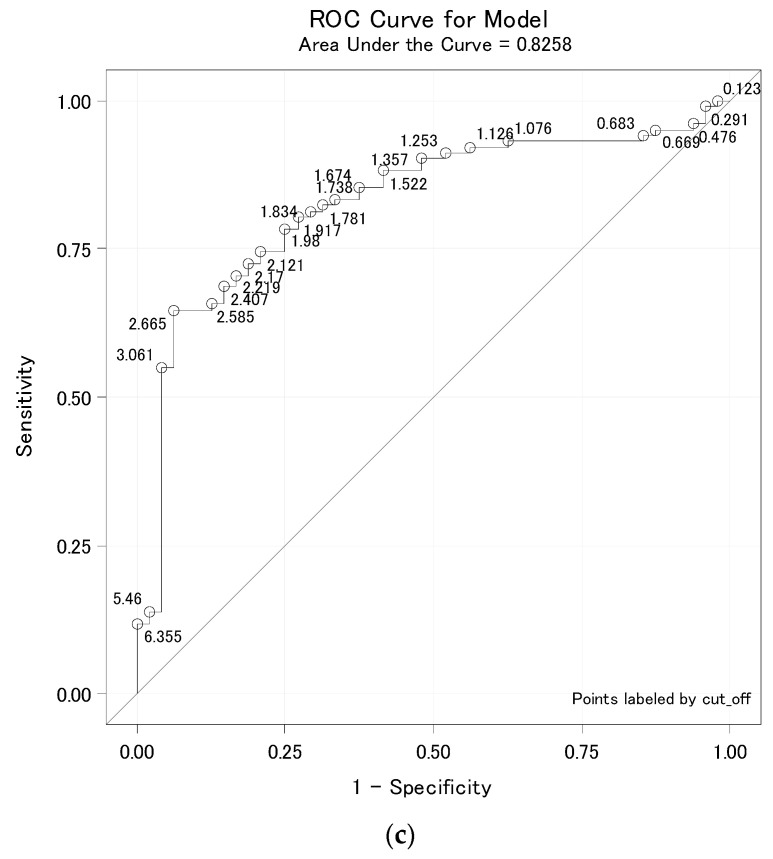
Figure 4.
(a) Diasorin cut-off for titer 160. (b) Beckman Coulter cut-off for titer 160. (c) Euroimmun cut-off for titer 160. Legend: ROC curve for Diasorin, Beckman Coulter and Euroimmun, titer <160 vs. ≥160 where the ROC curve is labeled by all possible cut-offs. These ROC curves are already typical. Thus, specificity can be targeted as close to 95%. For cut-off values for individual methods, see Table 4.


