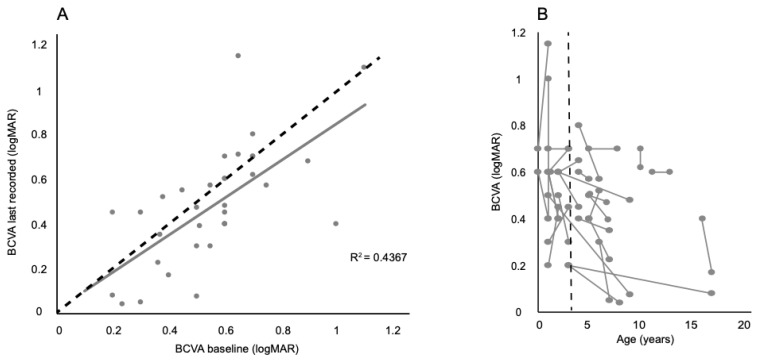
Figure 1.
Best corrected visual acuity (BCVA) changes in albinism patients. (A) Correlation between the change in BCVA at baseline and most recent follow up. The black dashed line represents a ‘no change’ scenario, while the grey correlation line illustrates the subtle change seen in patients. (B) Demonstrates the change in BCVA of each paediatric patient at baseline and most recent vision as a function of age. The black dashed line represents the point at which more accurate visual acuity testing can be achieved in children 3 years old and upwards.

