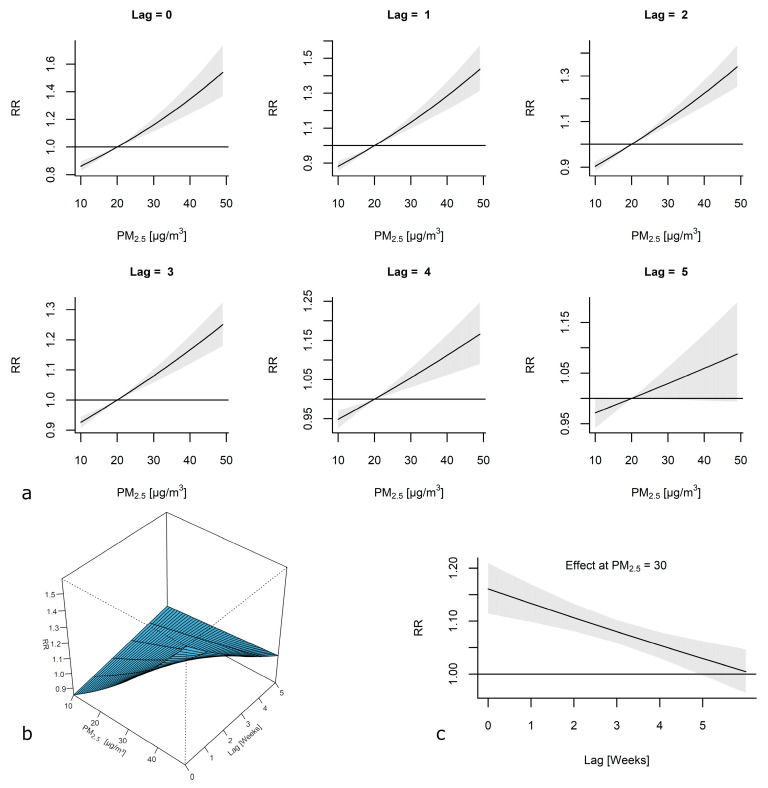
Figure 4.
(a) The association between the concentration of PM2.5 and the relative risk (RR) of the incidence of influenza-like illness (ILI) is depicted as the estimated exposure–response curves for lags of 0 to 5 weeks with 95% confidence intervals (CIs). (b) The association between the concentration of PM2.5 and the RR of the incidence of ILI is depicted as the estimated exposure-lag-response surface. The model was adjusted for the mean air temperature and a long-term trend. (c) The estimated lag–response curve for PM2.5 = 30 µg/m3 with 95% CI.

