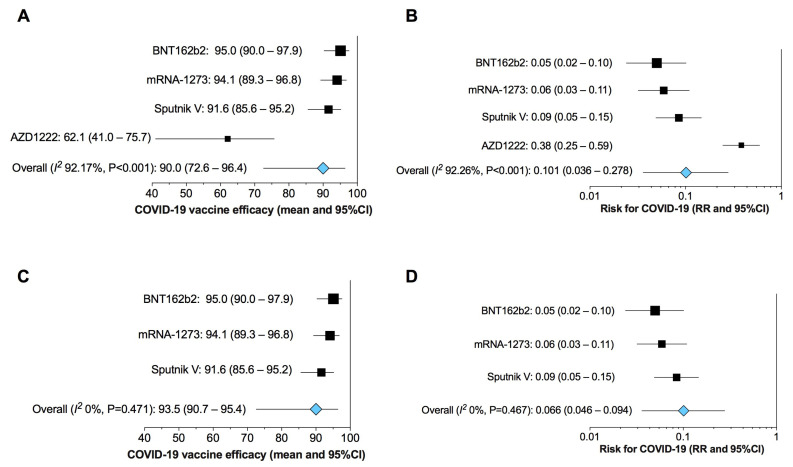
Figure 2.
Forest plot of the overall and sensitivity analyses on the efficacy of COVID-19 vaccines in preventing the illness (A,C) and on the RR for COVID-19 after vaccine administration (B,D) vs. negative control. COVID-19: Coronavirus Disease 2019; RR: relative risk; 95%CI: 95% Confidence Interval.

