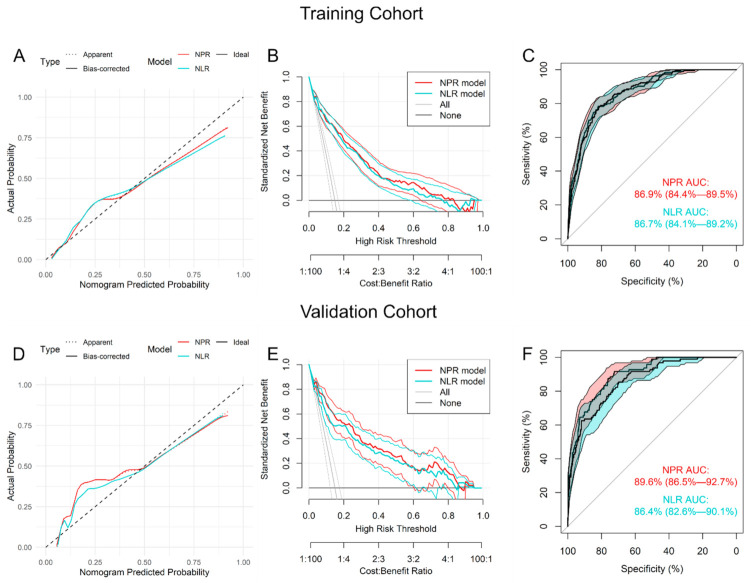
Figure 4.
Evaluation of the prediction value of nomograms VNPR (red) and VNLR (blue) in the training (A–C) and validation (D–F) cohorts. (A,D) Calibration plots (pointed lines represent the apparent calibration curves, solid lines represent the bias-corrected calibration curves obtained from the 1000 bootstrap and dashed line represent the ideal calibration curve), (B,E) decision curves and (C,F) ROC curves of the nomogram score. Abbreviations: NLR, neutrophil-lymphocyte ratio; NPR, neutrophil-platelets ratio; VNLR, velocity neutrophil-lymphocyte ratio; VNPR; velocity neutrophil-platelets ratio.

