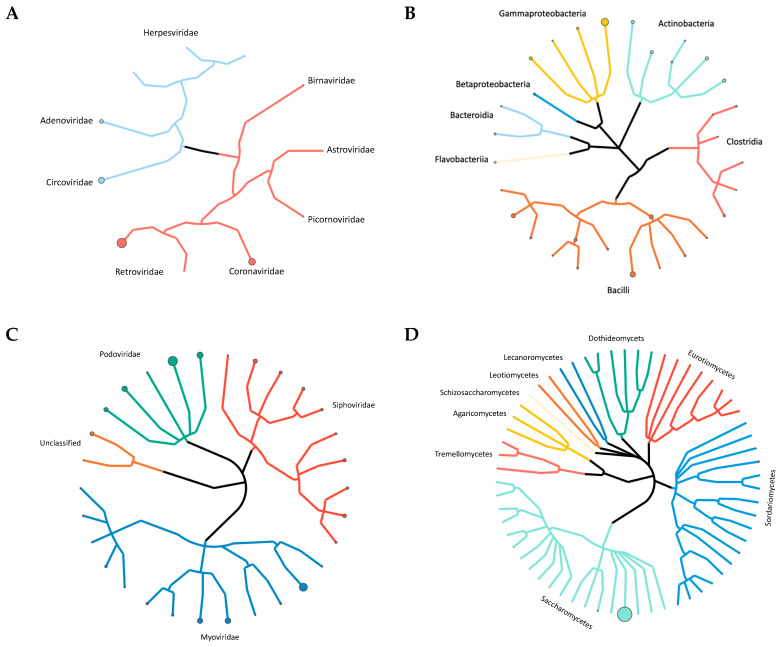
Figure 5.
Phylogenetic tree of (A) virus, (B) bacteria, (C) bacteriophage and (D) yeast and fungi. Node diameter indicates average abundance at species (A,C,D) and genera (B) level. Taxonomic levels range from phylum to genera (B), order to species (C) phylum to species (D). Viruses (A) are organized according to structural classification.

