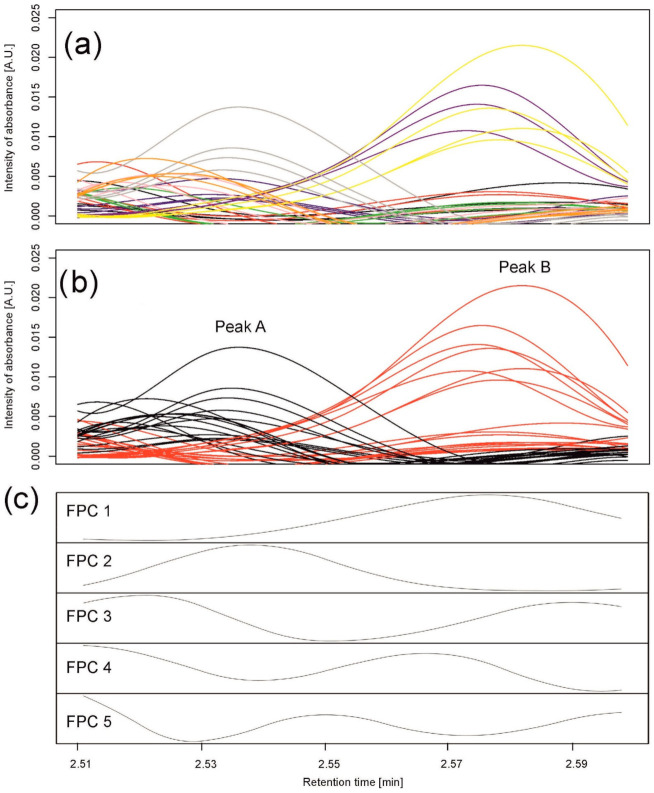
Figure 4.
Data analysis for peaks observed in barley samples taken on the 6th day of the drought variant I for wavelength 280 nm. (a) Observed chromatograms; colors indicate varieties: black—Maresi; red—Lubuski; blue—Georgia; green—Harmal: pink—Cam/B1/CI; purple—MDingo; yellow—Morex; gray—Sebastian; and orange—Stratus. (b) Observed chromatograms; colors indicate two clusters obtained by Method 1. (c) First five eigenfunctions obtained by Method 2 accounting for 99.93% of the total variance. Functional principal component 1 (FPC1) (76.88% of the variance) corresponds to peak (cluster) B, and the component FPC2 (18.32% of the variance) to peak (cluster) A.

