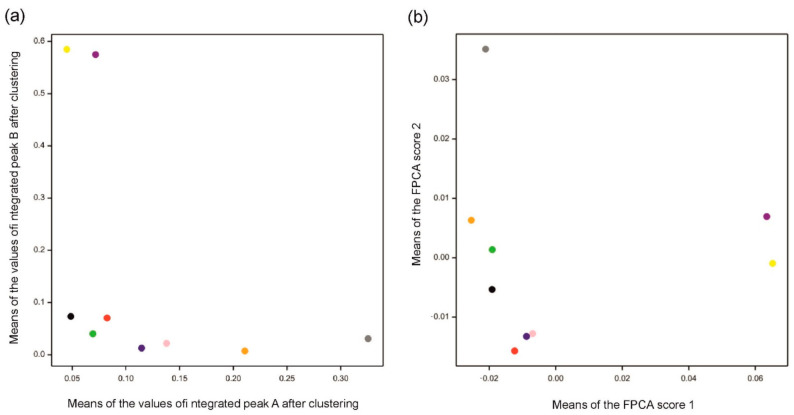
Figure 6.
Means for varieties obtained by (a) Method 1 using clustering and (b) Method 2 using functional principal component analysis (FPCA). Mean values in (a) were computed over four replications for each variety over integrated peaks A and B obtained by clustering. Mean values in (b) were computed over four replications for each variety for the two first FPC scores. Different colors indicate varieties (see caption of Figure 4). Note that positions of varieties along FPC score 1 correspond to those along the values of peak B and positions along FPC score 2 correspond to those for peak A.

