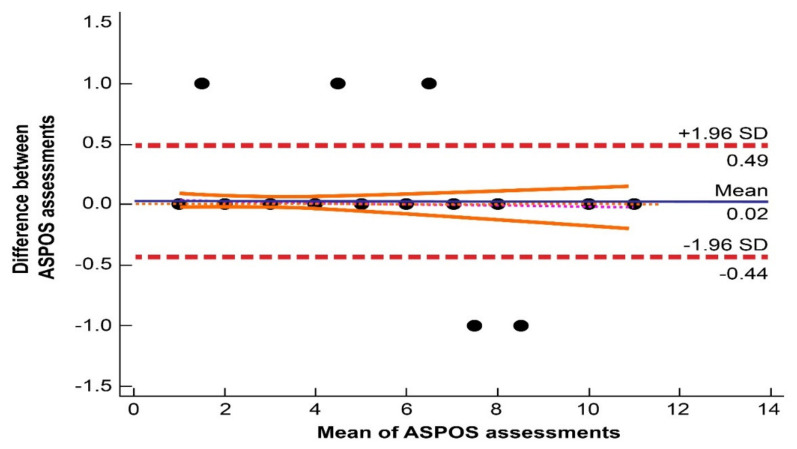
Figure 1.
Bland–Altman diagram presenting the high repeatability of Adam’s Scale of Posterior Stroke (ASPOS).The distribution of points (black plots) is based on the mean and the difference from the total ASPOS score obtained by two randomly selected researchers. The area between the dashed red lines indicates the limits of agreement. The mean of the limits of agreement is presented as a blue line. The area between the solid orange lines represents the 95% confidence interval of the regression line (a line composed of red dots).

