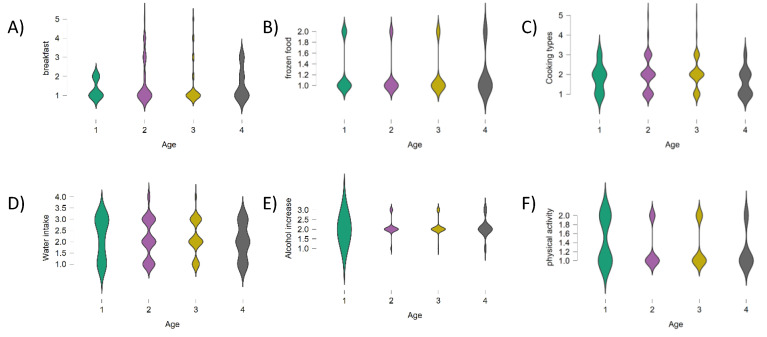
Figure 2.
Violin plots created with JASP (www.jasp-stats.org, accessed on 20 January 2021), distinguishing between four different age groups (1 = 0–17; 2 = 18–30; 3 = 31–55; 4 = >55) within (A) breakfast consumption (1 = daily; 2 = often; 3 = sometimes; 4 = rarely; 5 = never); (B) frozen food intake (1 = yes; 2 = no); (C) cooking types (1 = steam; 2 = oven; 3 = griddle; 4 = frying; 5 = microwave); (D) water intake (1 = yes; 2 = no); (E) alcohol increase consumption in respect to pre-Covid-19 period (1 = yes; 2 = no; 3 = no variation); (F) physical activity practice (1 = yes; 2 = no).

