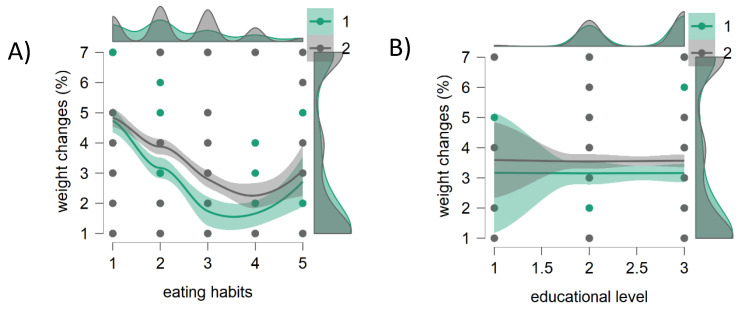
Figure 3.
Scatter plots created with JASP (www.jasp-stats.org, accessed on 20 January 2021). (A) The x-axis eating habits, y-axis weight changes (%); (B) x-axis educational level, y-axis weight changes (%). The lines for the relation between eating habits and weight changes (%) are different for female participants (1●), and male participants (2●). The relation between educational level and weight changes (%) is flat for both the genders. Eating habits is for the percentage variation of individual eating habits induced by the lockdown (1 = 0–5%; 2 = 5–20%; 3 = 20–50%; 4) 50–80%; 5 = > 80%); three educational levels were considered (1 = secondary school certificate; 2 = high school diploma; 3 = degree-master-PhD); weight changes were as follows: 1 = ↑1–3 kg; 2 = ↑3–7 kg; 3 = ↑>8 kg; 4 = ↓1–3 kg; 5 = ↓3–5 kg; 6 = ↓>6 kg; 7 = no variation).

