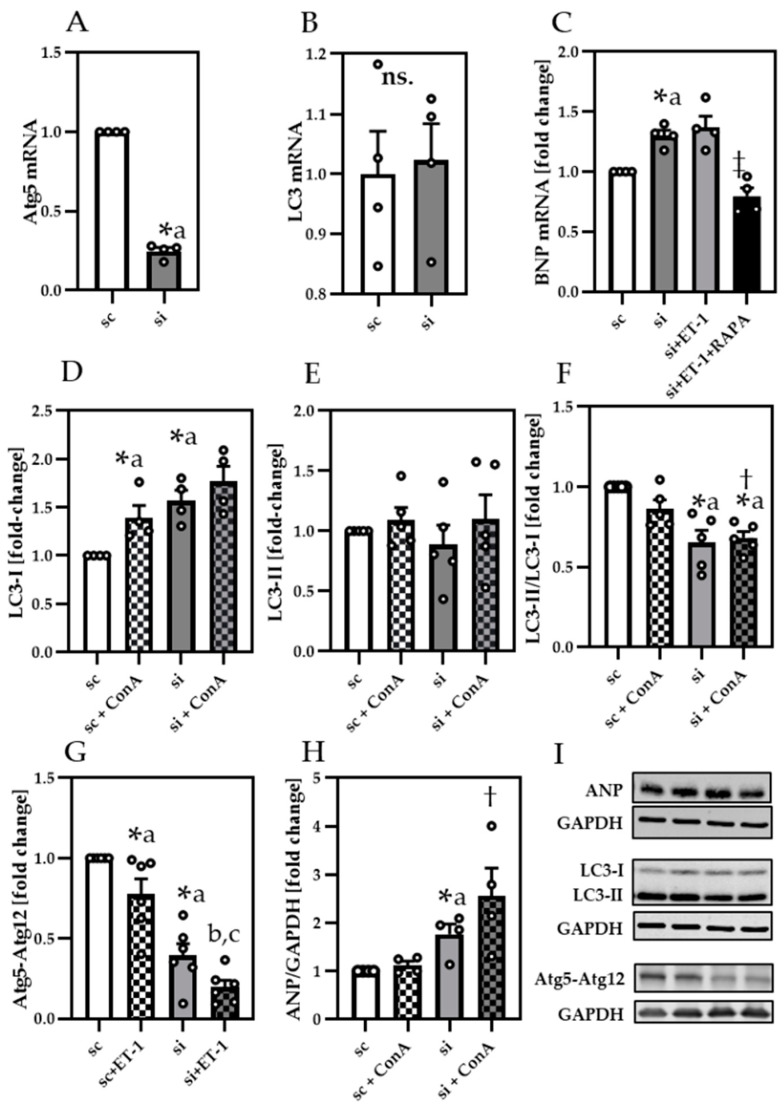
Figure 5.
Atg5 silencing increased ANP and decreased LC3-II lipidation (A) Relative gene expression of Atg5, (B) LC3 and (C) BNP. Protein analysis of (D) LC3-I, (E) LC3-II, (F) LC3-II/GAPDH to LC3-I/GAPDH (G) Atg5-Atg12 conjugate and (H) atrial natriuretic peptide (ANP) in scramble control (sc) and siAtg5 (si) treated neonatal cardiomyocytes. (I) Representative immunoblots of ANP, LC3-I, LC3-II, Atg5-Atg12 conjugate and their respective GAPDH control. Data are presented as fold change of sc and shown as Mean + SEM of biological replicates. Statistical analyses were performed by unpaired t-test or one-sample t-test (indicated with a), comparing two treatments directly. Statistically significant differences were shown by p < 0.05, * vs. sc, ‡ vs. si + ET-1, † vs. sc + ConA, b vs. sc + ET-1 and c vs. si. ns = not significant.

