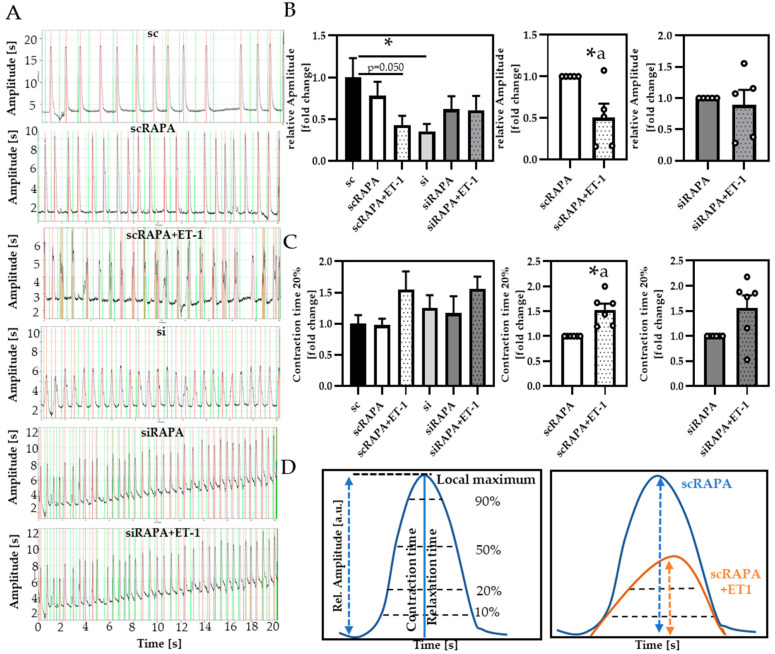
Figure 6.
Atg5 siRNA and ET-1 decreased cardiomyocyte contractility by downregulation of autophagy. (A) Representative contraction profiles of the respective conditions, red local maxima, green local minima. (B) Relative amplitude of contraction and (C) Contraction time 20% (CT20). (D) Illustration of movement parameters analyzed in spontaneously contracting neonatal cardiomyocytes, using Myocyter. All data are presented as Mean + SEM of biological replicates and statistical analyses were performed be either one-way-ANOVA followed by Tukey’s posttest or One-sample t-test (indicated with a). Statistically significant differences are shown by p < 0.05, * vs. sc or scRAPA and p = 0.050 comparing sc vs. scRAPA + ET-1, using Unpaired t-test.

