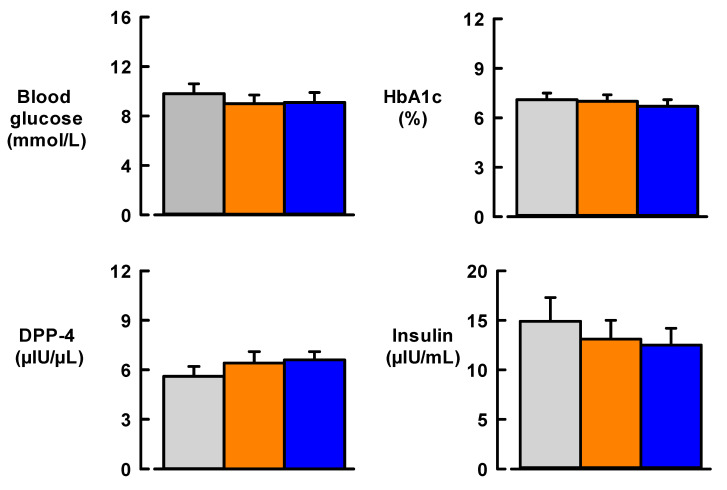
Figure 2.
Effect of 12-week Mediterranean diet intervention (blue bars) or usual diet (orange bars) on glycaemic status compared with baseline levels (Grey bars) in participants with type 2 diabetes. Sample size, N = 19. Data are mean ± SEM. HbA1c, haemoglobin A1c; DDP4, dipeptidyl-peptidase 4. For insulin (1 µIU/mL = 6.945 pmol/L).

