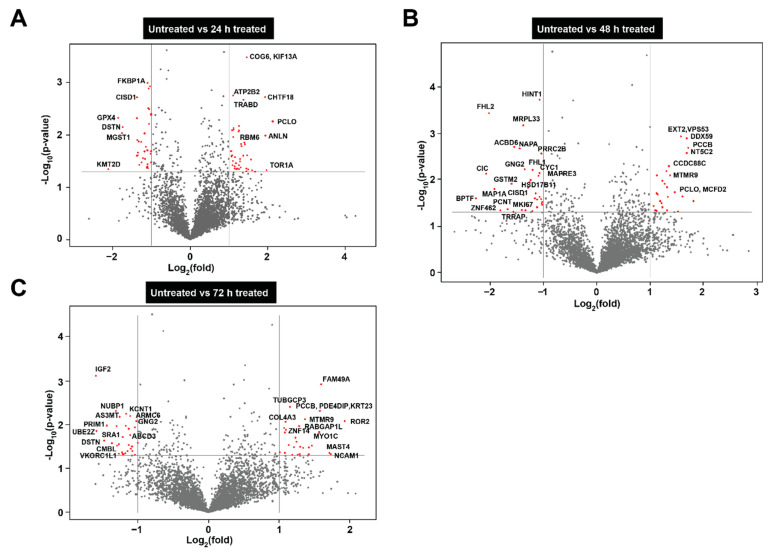
Figure 4.
Depiction of differentially abundant proteins via volcano plots. (A) Volcano plot depicting the differential abundance of proteins in 24 h treated NBL cells compared to untreated. (B) Representation of differential abundance of proteins in 48 h treated NBL cells compared to untreated. (C) Volcano plot of differentially abundant proteins at 72 h. Y axis= p-value of the protein expression X axis = ±2-fold changed proteins.

