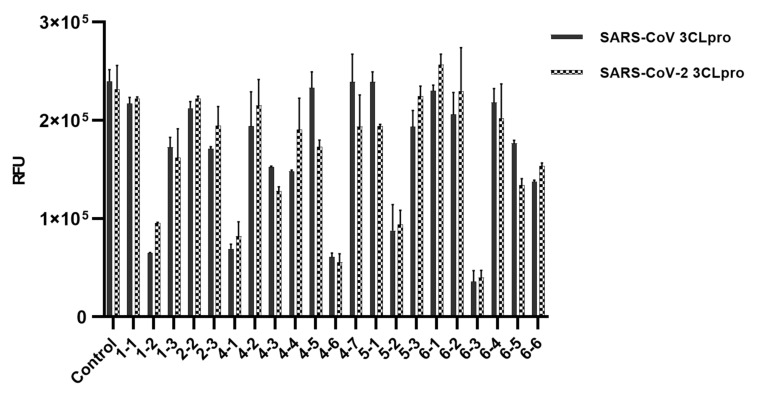
Figure 1.
Inhibitory screening data of the chemical library against SARS-CoV and SARS-CoV-2 3CLpros. All chemical (40 μM) were confirmed for their inhibitory potential through a comparison of actual absorbance with control at 490 nm. Three chemicals (Nos. 2-1, 3-1 and 5-4) were not plotted, due to the abnormal surge of Relative Fluorescence Units (RFU) after the proteolytic cleavage of the substrate. The RFU are plotted against the log-concentration of inhibitory compounds. Each dot is expressed as the mean ± standard error of the mean (n = 3).

