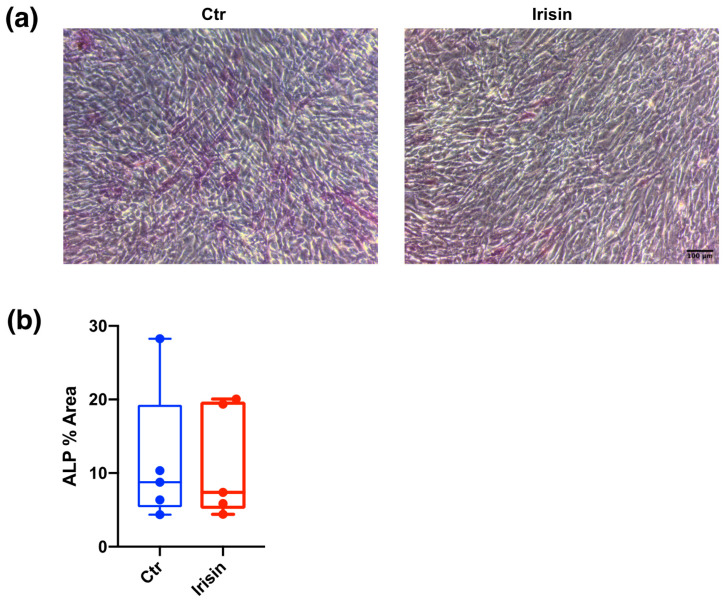
Figure 4.
Alkaline phosphatase (ALP) expression in DBSCs. (a) ALP expression assayed by ALP cytochemical assay (purple staining) in DBSCs cultured in osteogenic conditions and treated with irisin or not (Ctr) for 7 days. Representative phase contrast pictures were chosen for the figure. Scale bar: 100 μm. (b) The graph shows the quantification of ALP % area presented as box-and-whisker plots with median and interquartile ranges, from max to min, and is representative for five independent experiments performed in quadruplicates.

