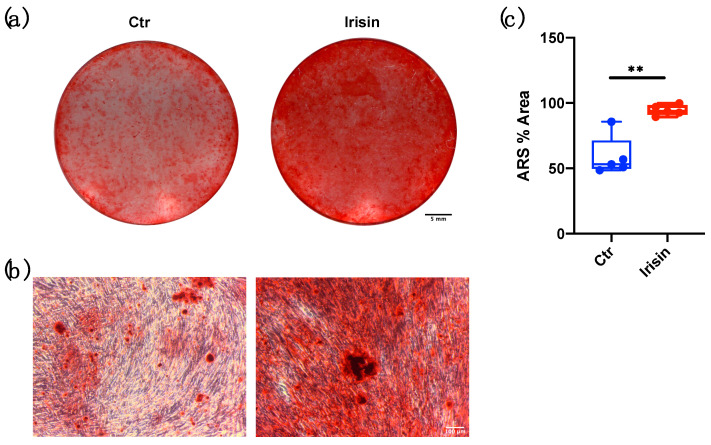
Figure 5.
Mineralized nodules formation following irisin stimulation and alizarin red staining (ARS) quantification. (a) Mineral matrix deposition, assessed by ARS (red staining), in DBSCs cultured in osteogenic conditions and treated with irisin or not (Ctr) for 21 days. The figure shows the wells of a representative experiment. Scale bar: 5 mm. (b) Phase contrast pictures displaying the formation of calcified nodules. Scale bar: 100 μm. (c) The graph shows the quantification of ARS % area presented as box-and-whisker plots with median and interquartile ranges, from max to min, and is representative for five independent experiments performed in quadruplicates. ** p < 0.01. Statistics: unpaired Student’s t-test.

