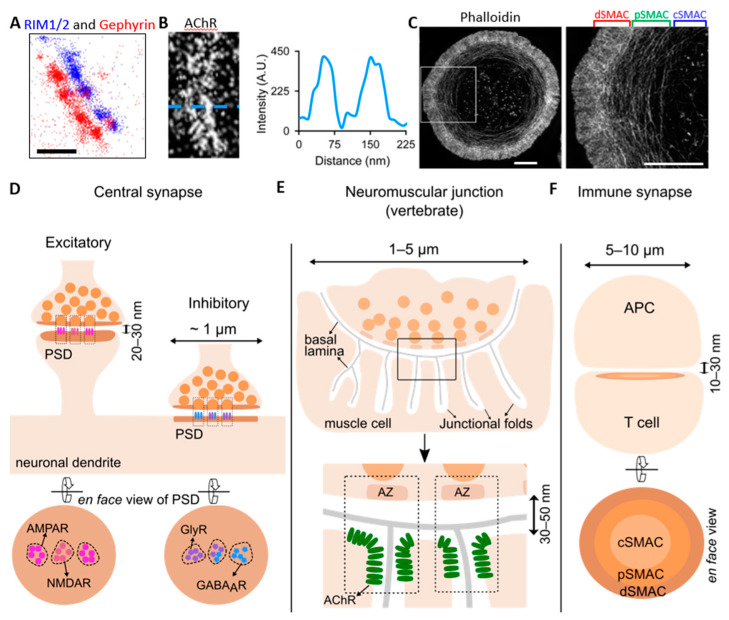
Figure 1.
Synaptic structures under super-resolution microscopy. (A) Dual-color direct stochastic optical reconstruction microscopy (dSTORM) of pre-synaptic Rab3-interacting molecule 1/2 (RIM1/2) (in blue) and post-synaptic gephyrin (in red) at inhibitory synapses in cultured spinal cord neurons, showing the alignment of their nanodomains (modified from [18]). Scale bar: 200 nm. (B) dSTORM of acetylcholine receptor (AChR) strip at a neuromuscular junction (NMJ) (left) and line-scan profile (right) showing the slit in the AChR strip [19]. (C) 3D-structured illumination microscopy (SIM) imaging of an activated Jurkat T cell stained with phalloidin, showing the discrete actin networks [20]. Zoom-in view of the boxed region on the left is shown on the right. Scale bar: 5 µm. (D) Excitatory and inhibitory synapses in the central nervous system, with a size generally below 1 µm and synaptic cleft of 20–30 nm. Post-synaptic receptors are organized into sub-synaptic domains (SSDs) and aligned with pre-synaptic vesicle release sites, forming trans-synaptic nanocolumns (indicated by boxes with dashed lines in the upper panel). The lower panel shows the en face view of the excitatory and inhibitory post-synaptic density (PSD). The left shows the N-methyl-D-aspartate receptor (NMDAR) SSD in the center and several α-amino-3-hydroxy-5-methyl-4-isoxazolepropionic acid receptor (AMPAR) SSDs surrounding it at the excitatory PSD. The right shows the glycine receptor (GlyR) and γ-aminobutyric acid type A receptor (GABAAR) SSDs and their partial overlapping at the inhibitory PSD. (E) The vertebrate neuromuscular junction (NMJ), which has a diameter of 1–5 µm, and the synaptic cleft is 30–50 nm (lower panel). The muscle cell plasma membrane forms many junctional folds, and the synaptic cleft is resided by the basal lamina. The lower panel is the zoomed-in view of the boxed region in the upper panel. The dashed boxes indicate the trans-synaptic nanocolumns consisting of the pre-synaptic active zones (AZ) and the post-synaptic AChR clusters at the junction crest shoulder. (F) The immune synapse (IS) formed between T cell and antigen-presenting cell (APC), with a size of 5–10 µm and a cleft of 10–30 nm. The lower panel is the en face view of the post-synaptic compartment of the IS, depicting the central supramolecular activation cluster (cSMAC) enriched in T cell receptors (TCRs, light orange), the peripheral SMAC (pSMAC) enriched in linker for activation of T cells (LATs, orange), and the distal SMAC (dSMAC) enriched in F-actin (brown).

