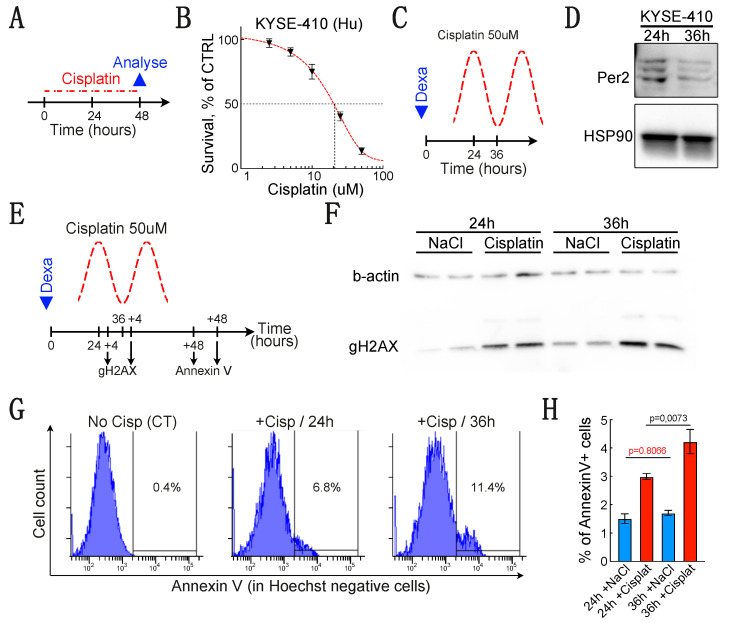
Figure 4.
A low PER2 expression is associated to higher sensitivity to cisplatin-induced apoptosis. (A) Experimental design. (B) KYSE-410 survival measured using MTS assay 48 h after cisplatin treatment. The red sigmoid curve is a guide for the eye. Data are represented as mean +/− SEM (n = 5). (C) Experimental design to treat KYSE-410 when PER2 expression is high or low (24 or 36 h after synchronization respectively). (D) Western blot showing the expression of PER2 24 or 36 h after synchronization. (E) Schematic representation of the cisplatin treatment timeline and the time-points selected to collect the samples for DNA damage (γH2AX) evaluation and apoptosis (annexin V) measurement. (F) Western blot showing the expression of γH2AX after a 4-h cisplatin treatment either 24 or 36 h post-synchronization. Cells were either treated with vehicle alone (NaCl) or with 50 μM cisplatin. (G) Representative histogram showing the proportion of Hoechst-/Annexin V KYSE-410 cells measured by flow cytometry 48 h after the end of the cisplatin treatment. Cells were either not treated (NaCl = vehicle) or treated for 4 h with 50 μM cisplatin 24 or 36 h after synchronization. (H) Histogram summarizing the proportion of Hoechst-/Annexin V KYSE-410 cells measured 48h after the end of the cisplatin treatment. Data are represented as mean +/− SEM (n = 8). p-values were calculated using a two-way ANOVA followed by Sidak’s post hoc test. Fixed effect: Time/p = 0.0110; Cisplatin/p < 0.0001; Time x Cisplatin/p = 0.0527.

