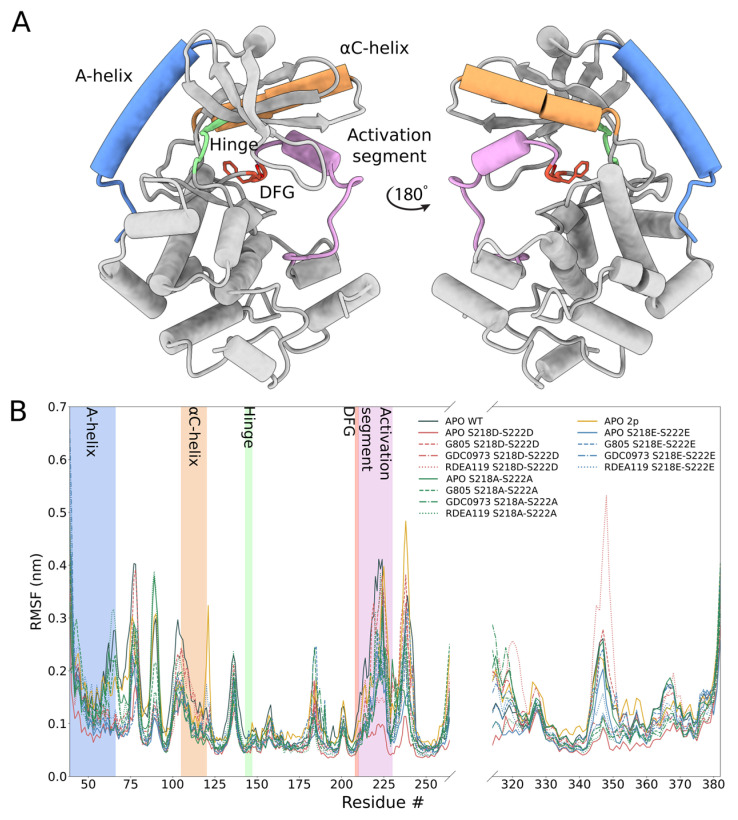
Figure 3.
Structural overview of phosphorylation-mimetic MEK1 mutants: (A) Three-dimensional representation of the human MEK1 model used in MD simulation experiments. Coloring of secondary structure elements that undergo rearrangement during activation conforms with those regions highlighted in the RMSF analysis. Residue # represents amino acid position number. (B) Root-mean-square fluctuation (RMSF) analysis of WT MEK1, MEK1-S218D-S222D, MEK1-S218E-S222E, MEK1-S218A-S222A and corresponding ligand-bound complexes shows increased backbone displacement in and around regions engaged in kinase activation for Asp/Asp mutants relative to Glu/Glu and Ala/Ala mutants, signifying that open conformations are more prevalent in S218D-S222D systems.

