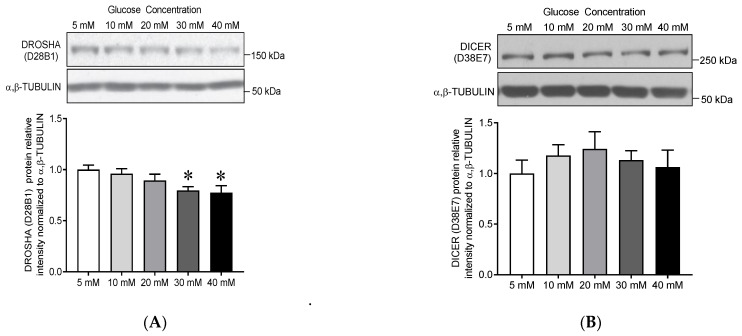
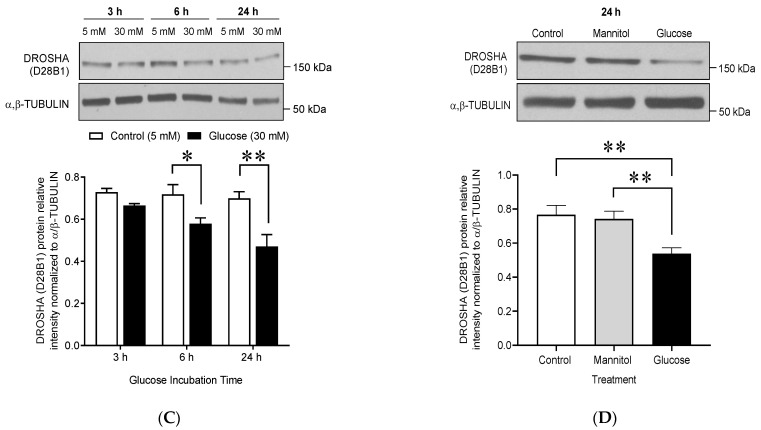
Figure 2.
Dose and time effect of glucose treatment on DROSHA protein expression in human primary dermal microvascular endothelial cells (HDMECs). Immunoblots of (A) DROSHA (D28B1) and (B) DICER (D38E7) in human primary HDMECs treated with increasing concentrations of glucose for 24 h. α,β-TUBULIN was used as a loading control. Data are means ± SEM, n = 8. One-way ANOVA indicates a significant effect of glucose concentration (p < 0.05); * indicates significant differences compared to 5 mM glucose condition (p < 0.05, Bonferroni post hoc tests). (C) Immunoblot of DROSHA protein in HDMECs following 3, 6, and 24 h exposure to 5 and 30 mM glucose (data are means ± SEM, n = 3). (D) Immunoblots of DROSHA protein in HDMECs after 24 h treatment with 5 and 30 mM glucose, and 30 mM mannitol. Treatment with D-mannitol was used as an osmotic control. Data are means ± SEM, ** indicates significant difference compared to 30 mM glucose (** p < 0.01, 1-W ANOVA, Sidak Post hoc, n = 12).


