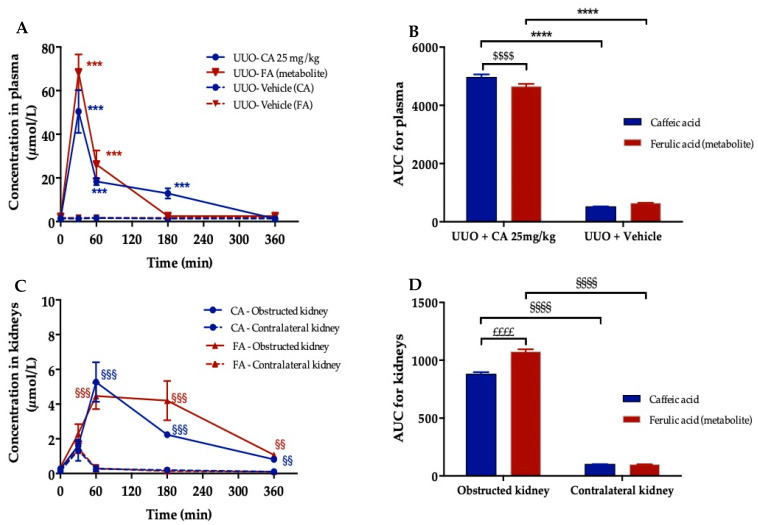
Figure 7.
Pharmacokinetic study of caffeic acid (CA) and ferulic acid (FA) after oral administration of CA (25 mg/kg) in 3 days-UUO mice. (A) Plasma concentration–time profiles of CA and its circulation metabolite, ferulic acid (FA), in UUO mice. (B) Corresponding area under the curves (AUC) of CA and FA in plasma. (C) Concentration–time profiles of CA and FA in obstructed and contralateral kidneys. (D) Corresponding area under the curves (AUC) of CA and FA in obstructed and contralateral kidneys. Concentrations were determined using UPLC-HESI-Q-orbitrap (Q-Exactive™ Plus). *** p < 0.001, **** p < 0.0001, compared to UUO + Vehicle; $$$$ p < 0.0001, compared to caffeic acid; §§ p < 0.01, §§§ p < 0.001, §§§§ p < 0.0001, compared to contralateral kidney; ££££ p < 0.0001, compared to caffeic acid. Values are means ± SD; n = 3 animals/time.

