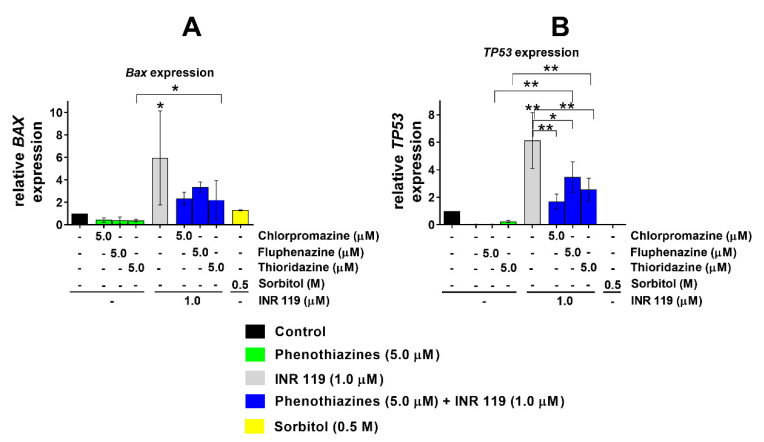
Figure 4.
Expression of TP53 and BAX mRNA (ΔΔCt analysis) normalised to ACTB after 24 h treatment. (A) BAX expression relative to control (medium + DMSO 0.1%). (B) TP53 expression relative to control (medium + DMSO 0.1%). Error bars show the standard deviation (* p < 0.05, ** p < 0.01). The raw qPCR data represented in this figure is found in Supplementary File S1.

