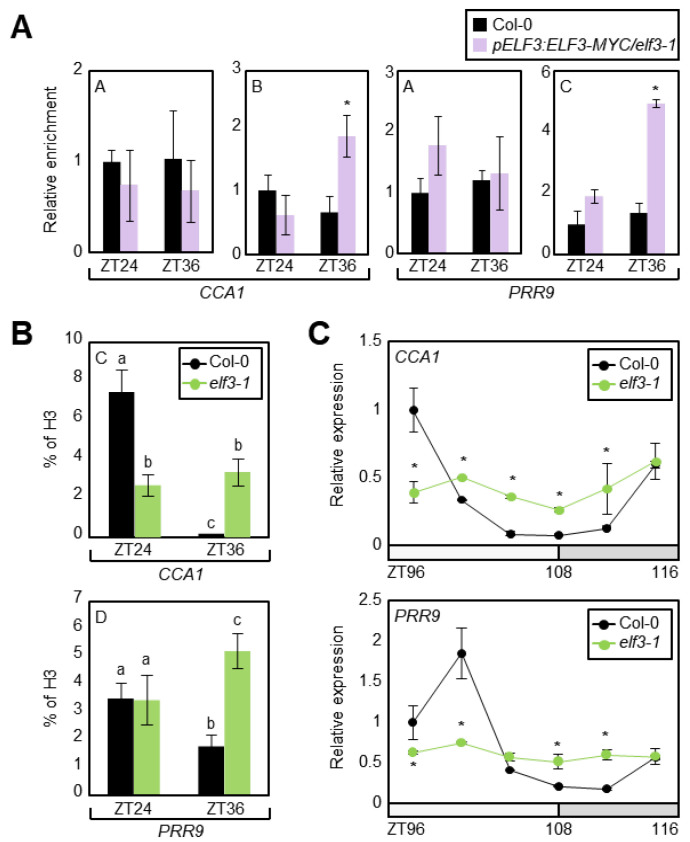
Figure 4.
Repression of CCA1 and PRR9 expression by EC via H3K4me3 demethylation. (A) Binding of ELF3 to the CCA1 and PRR9 promoters. Two-week-old plants grown in ND condition were subjected to LL at ZT0. Plants were harvested at ZT24 and ZT36 for ChIP assays. Enrichment of target chromatin regions was analyzed by ChIP-qPCR with the primer sets shown in Figure 2A. Biological triplicates were averaged and statistically analyzed with Student’s t-test (* p < 0.05). (B) H3K4me3 levels at the CCA1 and PRR9 loci in elf3-1 mutant. Plants were harvested at ZT24 and ZT36 for ChIP with anti-H3 and anti-H3K4me3 antibodies, and H3K4me3 levels were normalized to total histone H3 protein levels. Biological triplicates were averaged, and statistical significance of the measurements was analyzed by one-way ANOVA with Fisher’s post hoc test (p < 0.05). (C) Transcript levels of CCA1 and PRR9 in elf3-1 mutant. Two-week-old seedlings grown under ND were transferred to LL at ZT0. Whole seedlings (n > 15) were harvested from ZT96 to ZT116. Gene expression values were normalized to the eIF4A expression. Two technical replicates were averaged and statistically analyzed with Student’s t-test (*p < 0.05). Bars indicate the standard error of the mean. The white and gray boxes indicate the subjective day and night.

