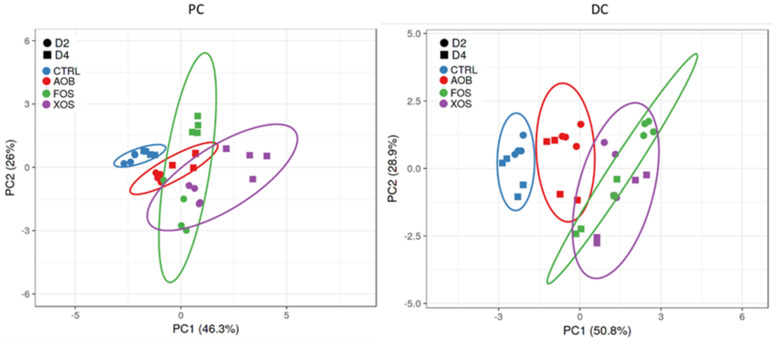
Figure 3.
Principle component analysis plots for (left) PC and (right) DC long-term SHIME samples, representing metabolic data (acetate, propionate, butyrate, BCFA, total SCFA and lactate) obtained on four different time points (days 3/4/10/11 of treatment) for blank control, AOB, XOS and FOS for two donors (D2 and D4). Ellipses indicate a confidence interval of 95%. PC = proximal colon; DC = distal colon; CTRL = control; AOB = antioxidant blend; XOS = xylooligosaccharides; FOS = fructooligosaccharides; D = donor; BCFA = branched-chain fatty acids; SCFA = short-chain fatty acids.

