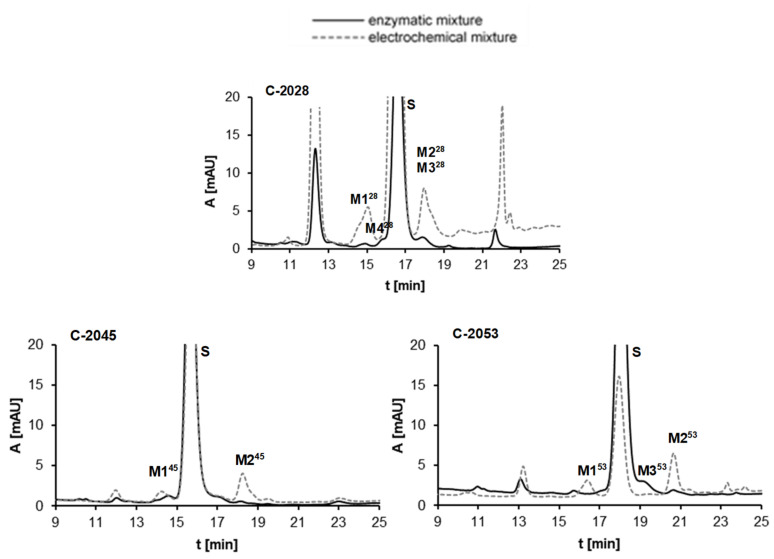
Figure 6.
Comparison of HPLC analyses of the reaction mixtures after 30 min enzymatic (UT-RLMs) incubations and the electrochemical conversions of 0.05 mM C-2028, C-2045 and C-2053. Experimental conditions: enzymatic analysis—0.1 M HEPES buffer, pH 7.4, 2 mg/mL UT-RLMs, 2 mM NADPH, 2 mM MgCl2; electrochemical analysis—water-methanol (1:1, v/v) with 0.1% formic acid as electrolyte, potential range −2.5–0 V, glassy carbon working electrode (ϕ = 8 mm).

