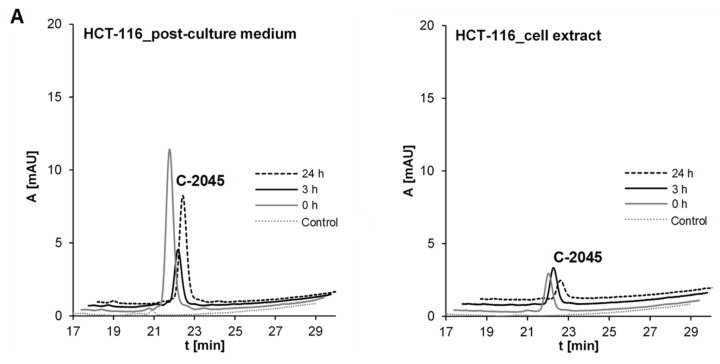
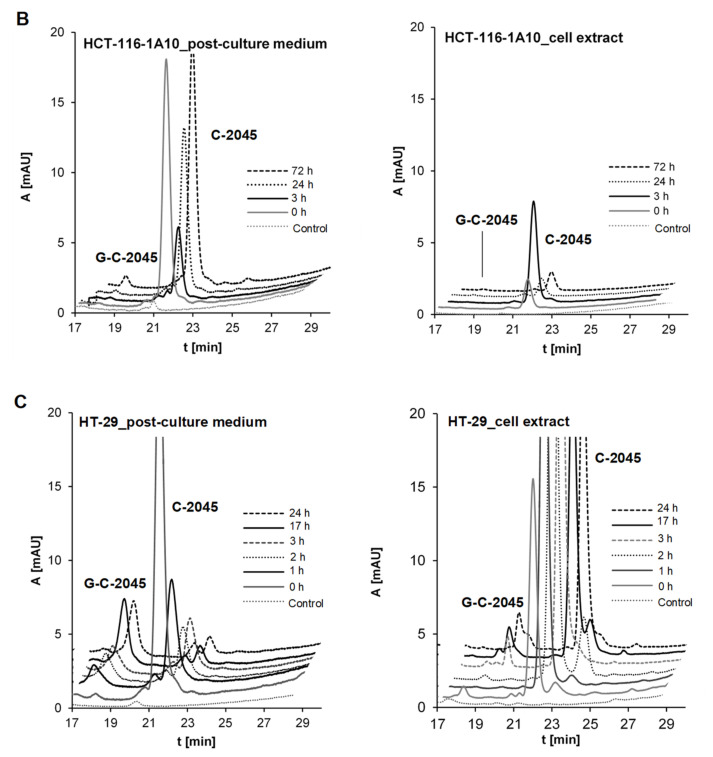
Figure 9.
Glucuronidation of C-2045 in (A) HCT-116 cells, (B) HCT-116-UGT1A10 cells and (C) HT-29 cells. Compound concentrations on the plate were: 50 μM, 50 μM and 25 μM, respectively. The results of HPLC analyses of post-culture media and cell extracts are presented as a set of chromatograms: Control (control of medium/cell extract from cells not treated with the compound) and after desired incubation times. Analysis at 430 nm by RP-HPLC (Shimadzu) and ESI-MS.


